Liquidation heatmap: how to read it and what it does not show
Market analytics · · 4 min
On sufics.trade the bitcoin liquidation heatmap is a model, not exchange data: it shows where leveraged positions could close according to the calculation, not where real positions are open and not where the price will go. The method is open, so you can recalculate the levels yourself.
By Viktor Skrin
What is a liquidation heatmap in simple terms?
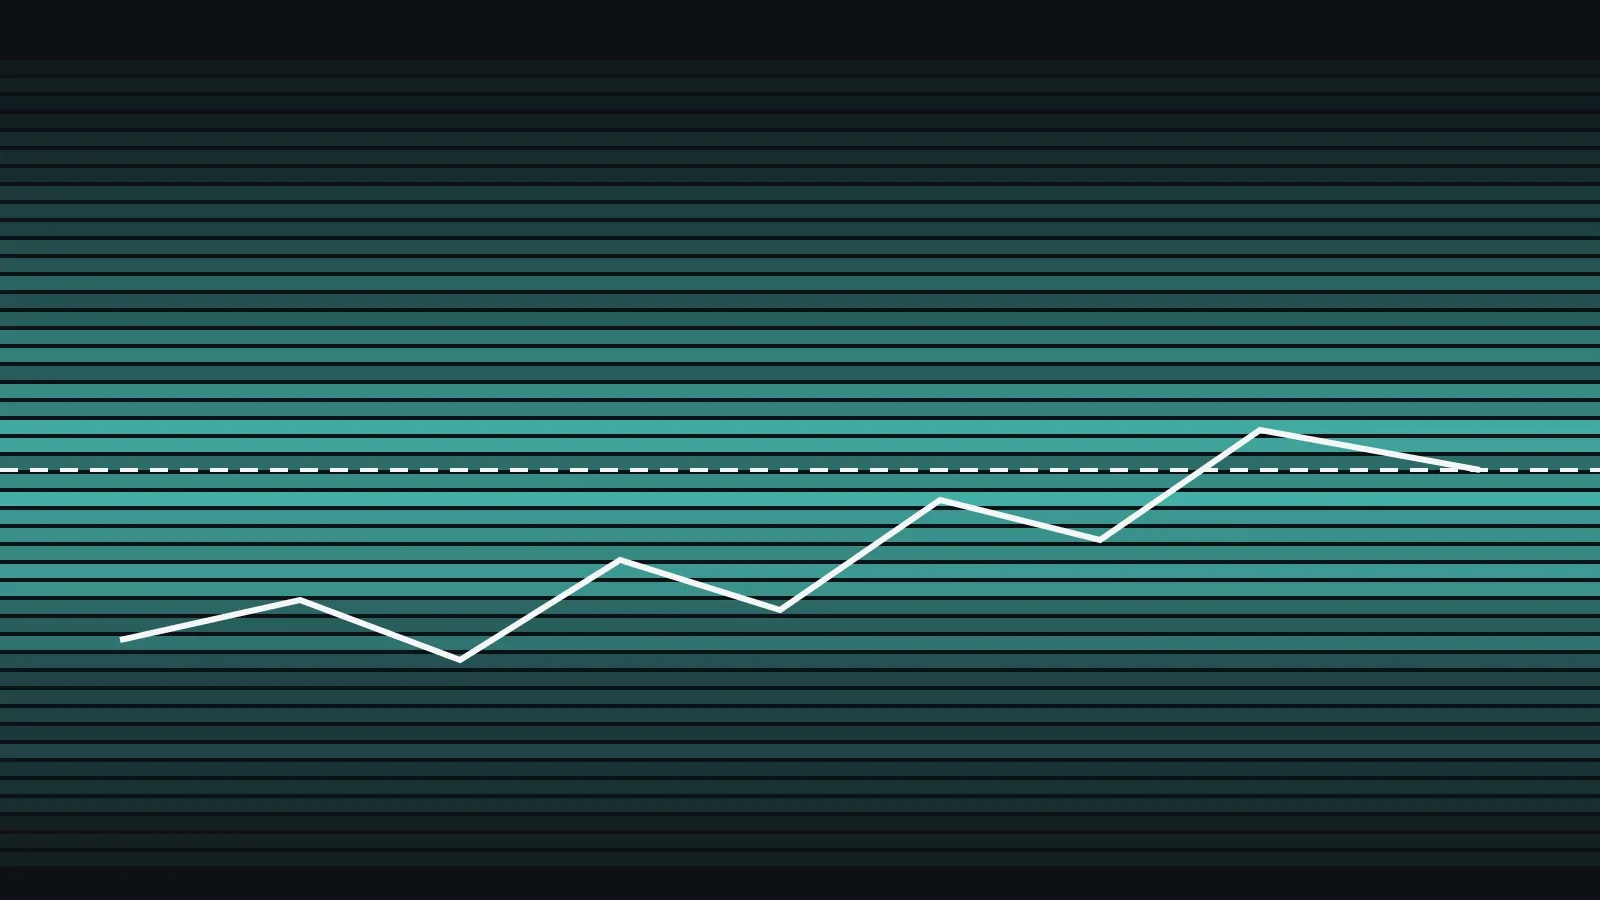
A trader who opens a long (a bet on a price rise) with leverage loses the margin when the price falls to the level where the exchange closes the position. That level is called the liquidation price. When many such positions sit close together, a band appears on the chart. A liquidation heatmap collects these bands by price.
One point first: exchanges do not publish where positions are opened or at what leverage. So any heatmap is an estimate. The map on sufics.trade is an estimate too, and it is labelled as a model, not as exchange data.
Where do the levels on the map come from?
The method is short, and you can check it step by step:
- For each bar (a time interval), the increase in open interest is counted. New positions are split evenly between longs and shorts.
- The positions are spread across leverage levels. Most of the share falls on 20–50×, because 20× is the default leverage on Binance. The shares by leverage are a model assumption, not exchange data.
- The liquidation price is the entry price minus (for a long) or plus (for a short) 1 / leverage, adjusted for maintenance margin. Hypothetical example: a 25× long opened at 100 has a liquidation level of about 96.5.
- A level is removed once the price has reached it: longs are checked against the bar's low, shorts against its high.
- If open interest falls, part of the positions is treated as closed, and all live levels shrink in the same proportion.
How do you read the bands on the map?
A dense band means many positions that, according to the model, would close at those prices. Bands above the current price are short liquidation levels, and bands below it are long levels. If the price reaches such a band, closing positions may speed up the move, but only if the model's leverage mix and volumes match the market.
The map is available for BTC and ETH on /liquidations#heatmap in two windows: 24 hours and 7 days. The short window shows fresh entries, and the long one shows older clusters that have not yet been hit.
Why use a model if exact data is not available?
The model answers a simple question: if the price moves in one direction, where would leveraged positions start to close first. The answer helps people who want to understand why a market sometimes moves sharply through a narrow price range. Exact positions are not needed for that, but it is essential to know that this is an estimate. That is why every number on the map is the result of a calculation with an open algorithm, not a fact about anyone's trades.
What does the map not show?
- Real trader positions. Only the exchange and the trader know them.
- Stop orders and limit orders, or how a given exchange will execute a liquidation at a price.
- The direction of the market. A cluster of levels does not say whether the price will reach it. The map is a model, not a signal.
- The causes of a move: news, regulator decisions, order book depth at the time of the move.
| Question | The liquidation map answers | The map does not answer |
|---|---|---|
| Where leveraged positions may close | Yes, according to the model | No, real positions are unknown |
| Where the price will go | No | No, this is not a forecast |
| How dense the levels are near the current price | Yes | — |
| Whether to open a trade | No | No, this is not investment advice |
How does this show up at Sufics?
Sufics publishes the map for BTC and ETH openly, and the method is described in public: you can repeat the calculation with your own candles and open interest data. This is how every calculation of ours is built: the method and the data are visible, and the conclusion about a trade stays with the reader. If the map has changed noticeably over a few days, the reason is usually that open interest and candle volumes grew or fell: the model recalculated the levels from these data, not from new known facts about the market.
For your own positions, the margin and the rules of your specific exchange matter more than the map: at what price change your position will close is checked in the exchange interface, not with a model.
Trading with leverage carries the risk of losing money, and the map does not guarantee that the price will reach any level.
Key takeaways
- A liquidation heatmap is a model estimate: exchanges do not publish real positions.
- The bands show levels where leveraged positions would close by calculation, not where the price will go.
- A dense band near the current price does not mean the direction of the move.
- Check the two windows, 24 hours and 7 days, and remember that this is a model.
- Check your own positions against your exchange's rules, not against the map.
Frequently asked questions
What is a liquidation heatmap in simple terms?
It is a chart where bands mark the prices at which leveraged positions would close according to a calculation. When the price reaches a band, positions with that liquidation level are closed by the exchange.
Does the map show real trader positions?
No. Exchanges do not publish open positions and leverage, so the map estimates them from open interest and candles. It is a model, not a list of trades.
How is the liquidation price calculated?
The entry price minus (for a long) or plus (for a short) 1 / leverage, adjusted for maintenance margin. Hypothetical example: a 25× long opened at 100 has a level of about 96.5.
Does a band above the price mean the price will go up?
No. A band above the price shows the level where short positions would close according to the model. It does not set the direction of the move, and it is not a forecast.
What data does a liquidation heatmap need?
Candles and the change in open interest over time. The model uses them to spread new positions across leverage levels and to recalculate the levels as the price reaches them.
Can the map tell me whether to open a trade?
No. It is not investment advice. Trading with leverage carries the risk of losing money, and the map does not guarantee that the price will reach any level.