Charts rebuilt: liquidation map, delta and order book
Platform ·
Candles of any Binance contract over a liquidation levels map, order flow delta with CVD, an order book summary and every crypto and TradFi ticker, with favorites saved to your account.
The Charts tab in the Market section has been rebuilt. On the left are a contract's candles over a liquidation levels map for 12 hours, a day, or 3, 7 or 14 days. On the right is every ticker: crypto USDT contracts by turnover and TradFi contracts by sector, with price and 24-hour change. The list sorts by its headers, sectors collapse, and search matches both ticker and name.
The list on the right is split into two tabs, Crypto and TradFi. Crypto holds every tradable Binance USDT perpetual, ordered by 24-hour turnover. Prices and the daily change arrive in one request to the exchange once a minute. The TradFi list is taken from the same snapshot as the TradFi section. Collapsed sectors are remembered per device, by the browser.
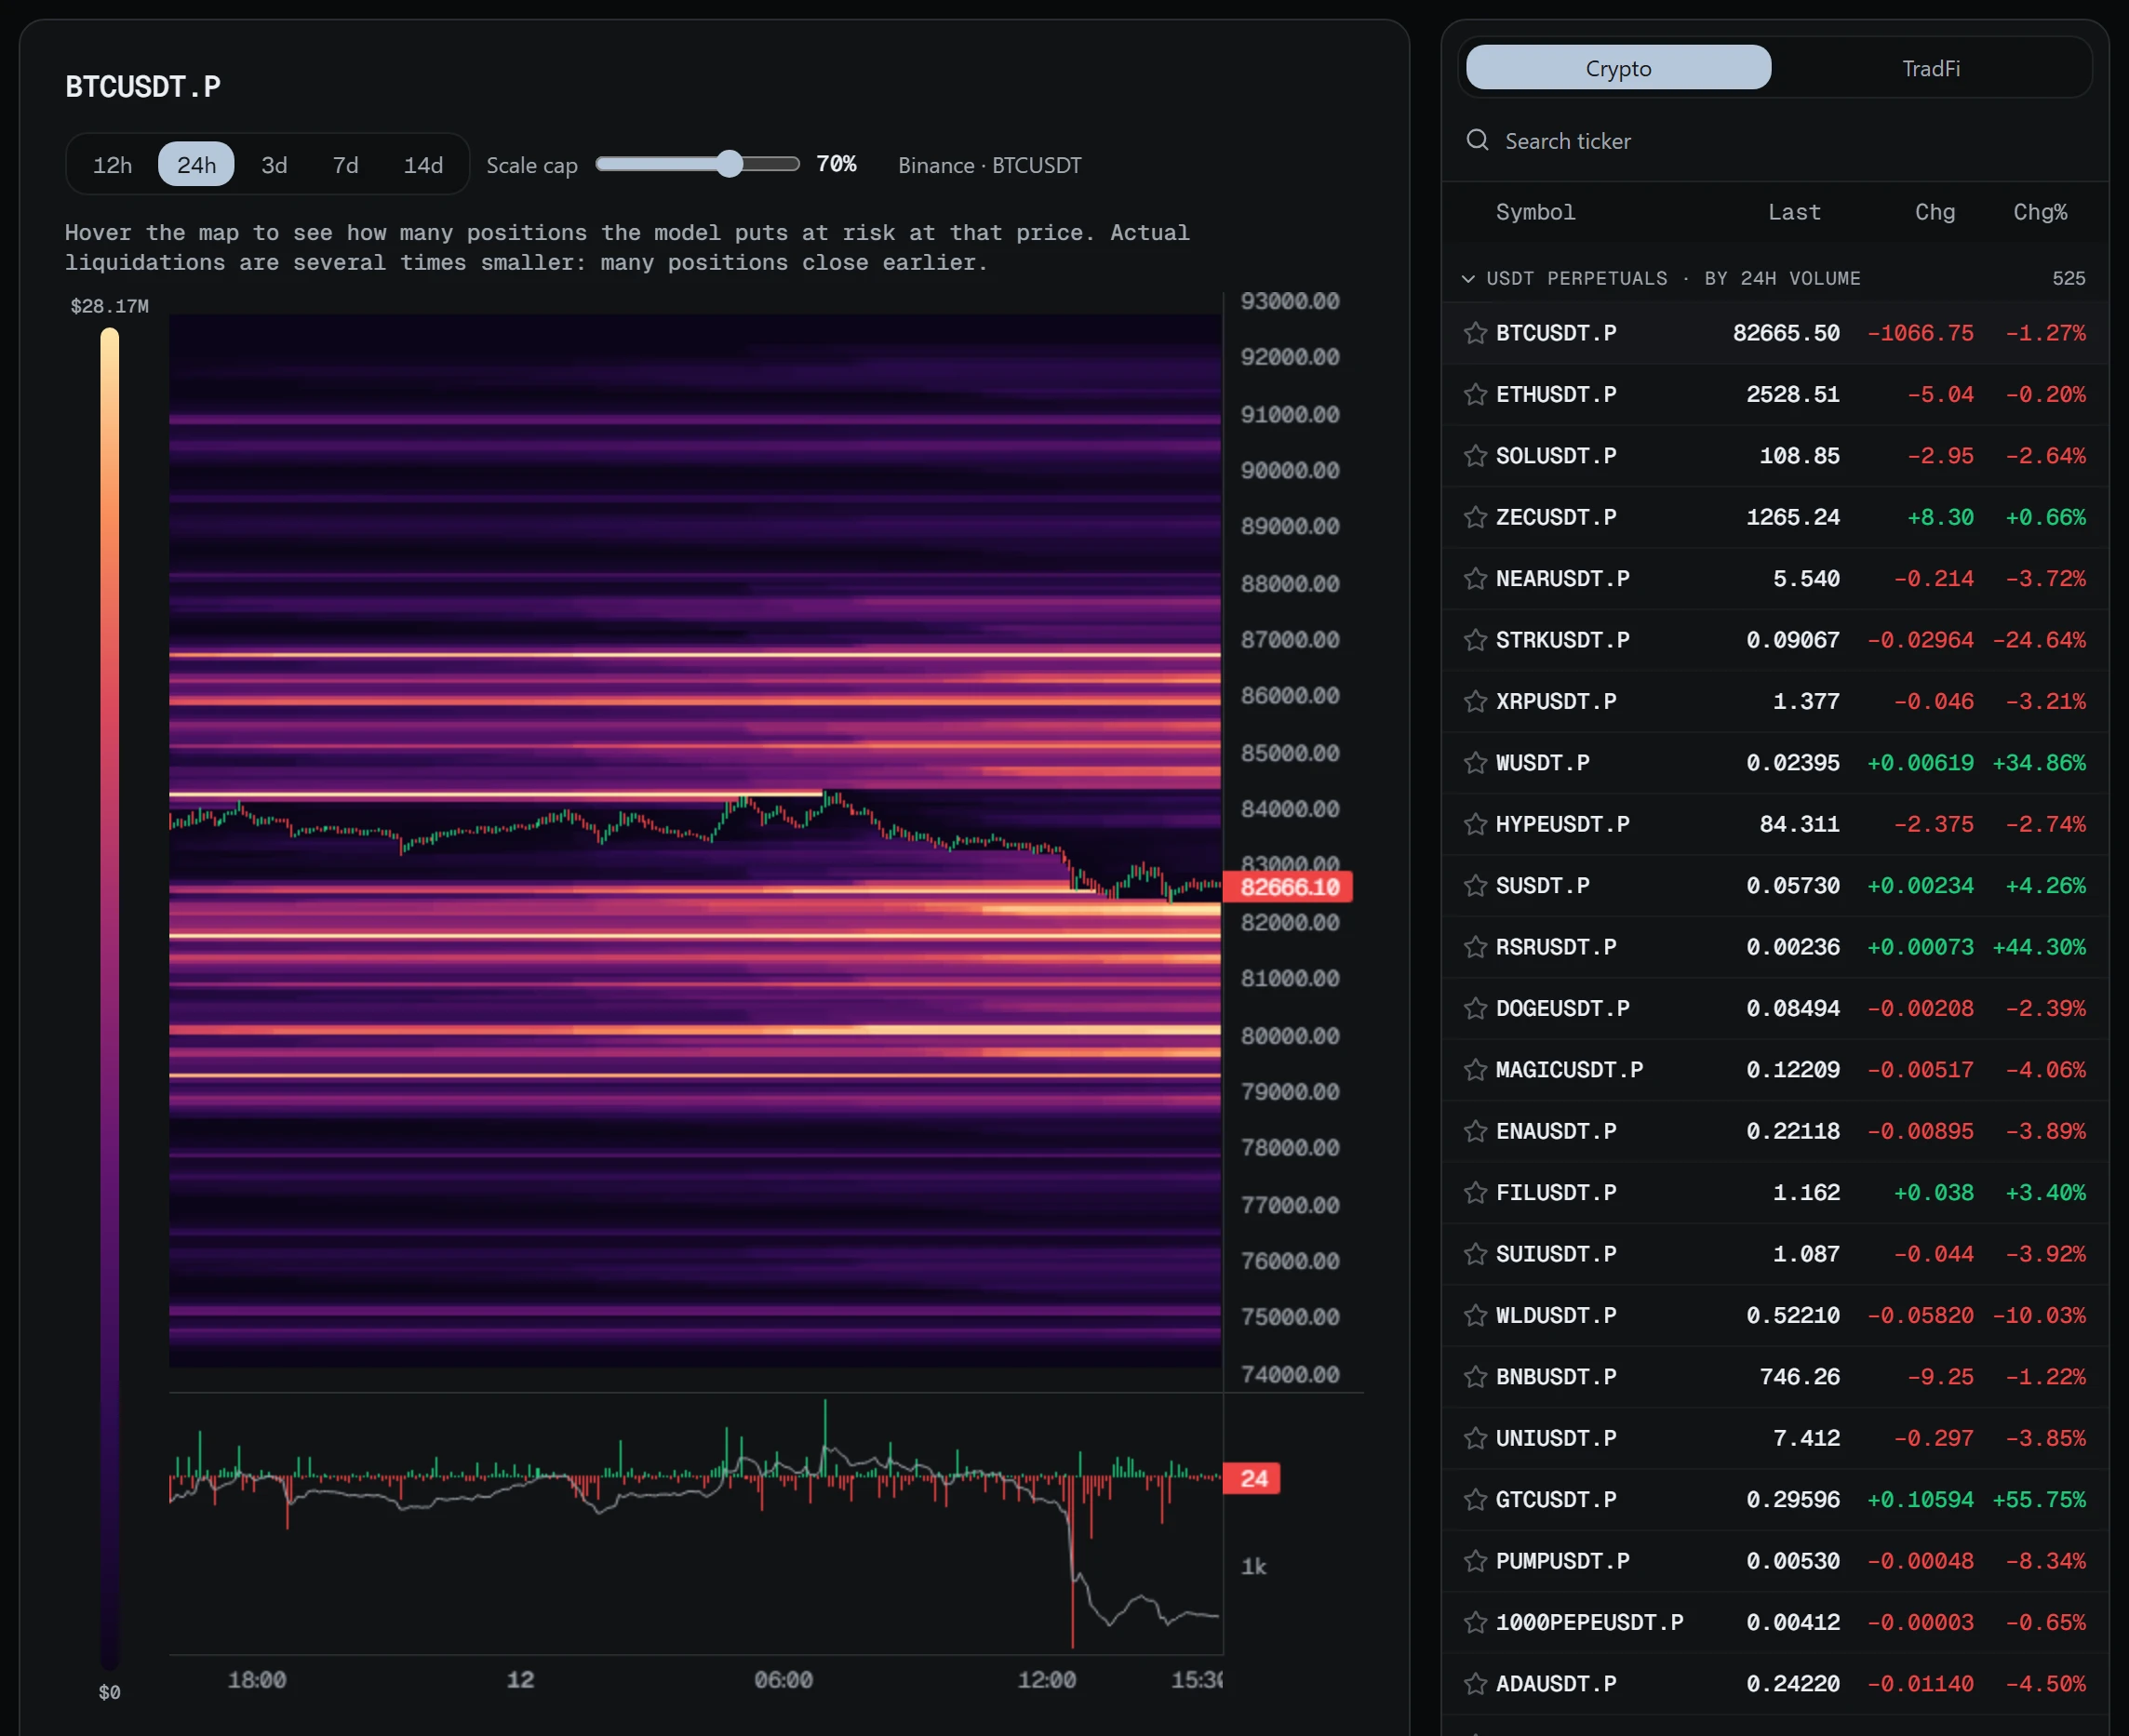
The map shows the prices where, by the model, leveraged positions have piled up that would be force-closed if the price got there. The model is built from Binance open interest growth and a typical spread of leverage. It is an estimate, not exchange orders: actual liquidations are usually several times smaller, so read the levels as zones. Under the candles is order flow delta, taker buys minus taker sells on each candle, with a CVD line, the cumulative delta. If the price rises while CVD falls, the rise is not backed by buying.
Growth in open interest on a candle counts as new positions, split equally between longs and shorts. They are spread across leverage from 5× to 125×, weighted toward 20–50×; the shares are an assumption, not exchange data. A liquidation level sits about 1/leverage from the entry price, adjusted for a 0.5% maintenance margin. A level disappears once a candle reaches it, and when open interest falls, live levels shrink in the same proportion.
The map windows use five-minute candles for 12 hours and a day, fifteen-minute ones for 3 days, half-hour ones for 7 days and hourly ones for 14 days. Before the window, the model warms up on 999 candles, so positions opened earlier do not vanish from the map. The browser calculates the map itself; the site supplies candles and open interest and caches them for a minute per contract and window.
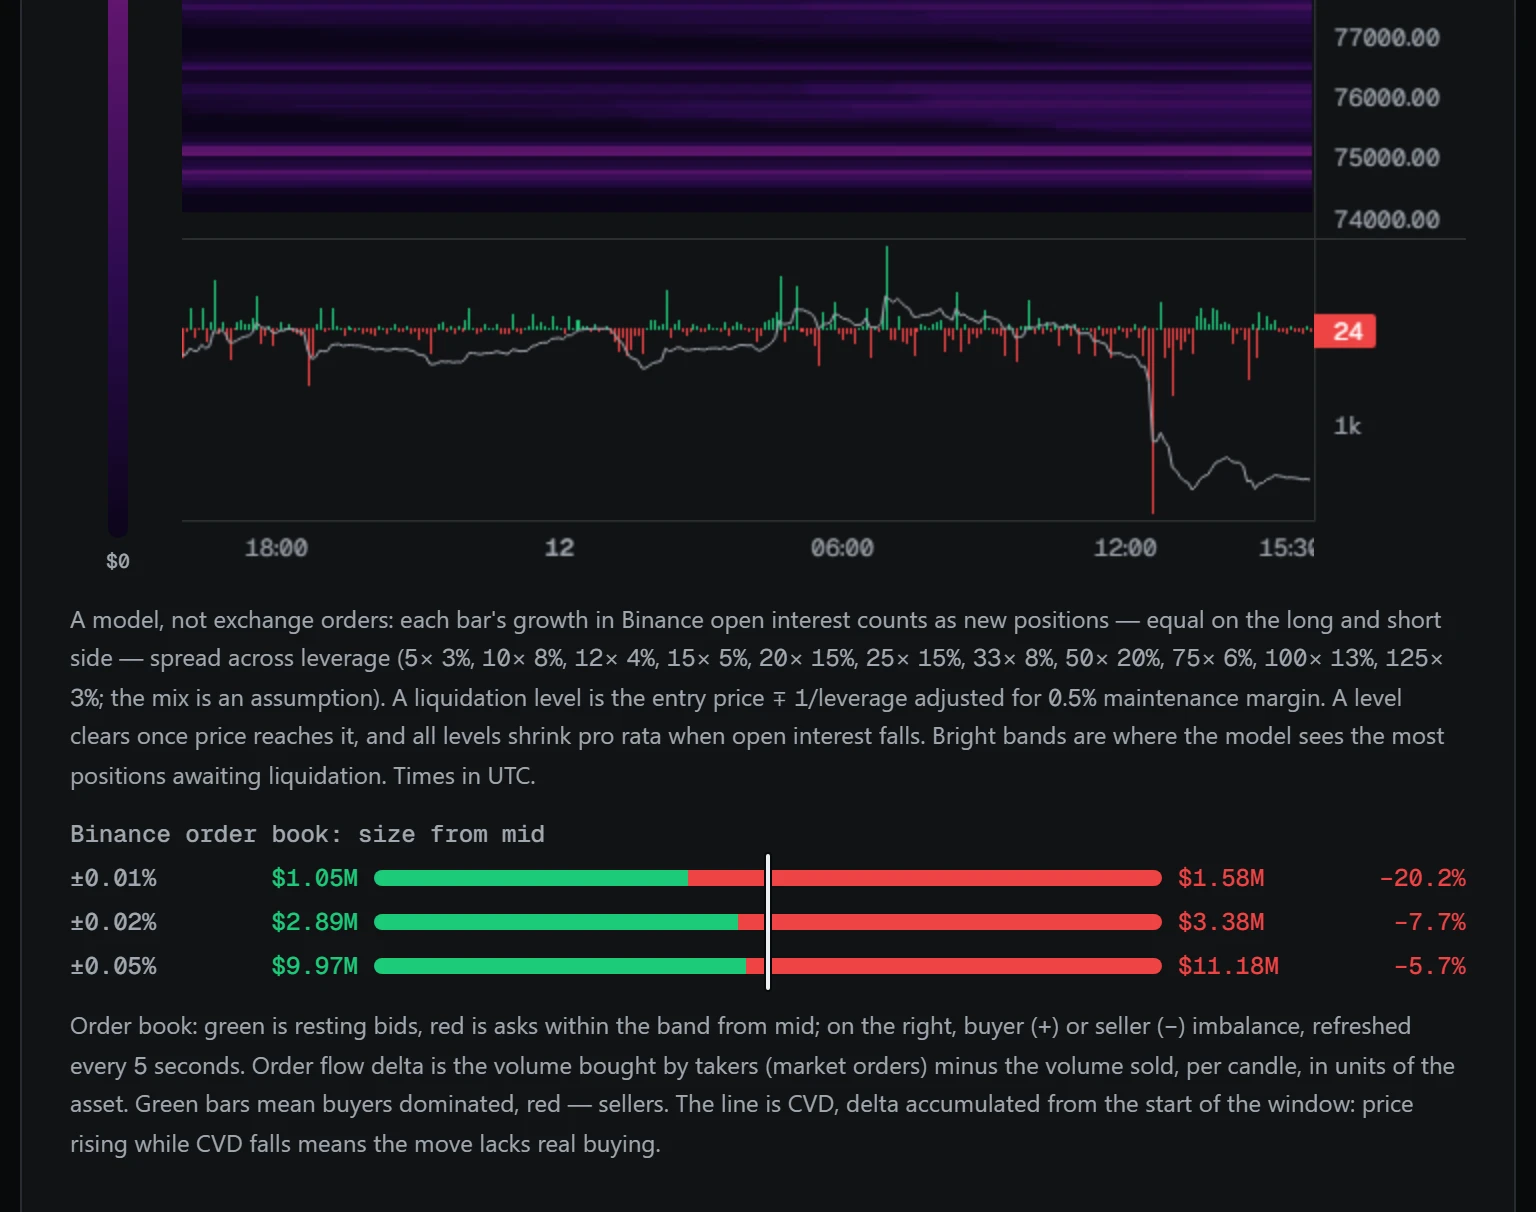
Below that is a Binance order book summary: how much is bid and offered in bands from the mid price, and which way the book leans. The book refreshes every 5 seconds, candles and the map once a minute. Favorites are stored in your account, so your stars are the same on every device.
The order book is loaded 500 levels deep and folded into three bands from the mid price, picked from a ladder from ±0.01% to ±2% within the depth the book actually reaches: for BTC hundredths of a percent, for thinner contracts up to a few percent. So the figures describe orders near the price, not the whole book. The imbalance is bids minus asks divided by their sum: a plus means buyers outweigh sellers, a minus the opposite.
The section opens in the client area. With full access every contract and window works; without activation you see a preview mode. Tickers of trades shown in the cabinet are added to favorites once, and an unstarred ticker does not come back. A public cut of the map is available without signing in at /liquidations: BTC and ETH for a day and for 7 days. The map, delta and order book describe the Binance market, are not investment advice, and leveraged trading involves the risk of losing money.