US earnings calendar and the price reaction
Platform ·
When more than 130 companies with stocks traded as Binance contracts report, how the price reacted to past reports and the move to expect from the next one.
The dashboard now has an earnings calendar. It covers the quarterly reports of more than 130 companies, mostly American, whose stocks trade as perpetual contracts on Binance: NVIDIA, Apple, Tesla, Micron, Oracle and others. For each report you can see the date and release time — before the market opens or after it closes, New York time.
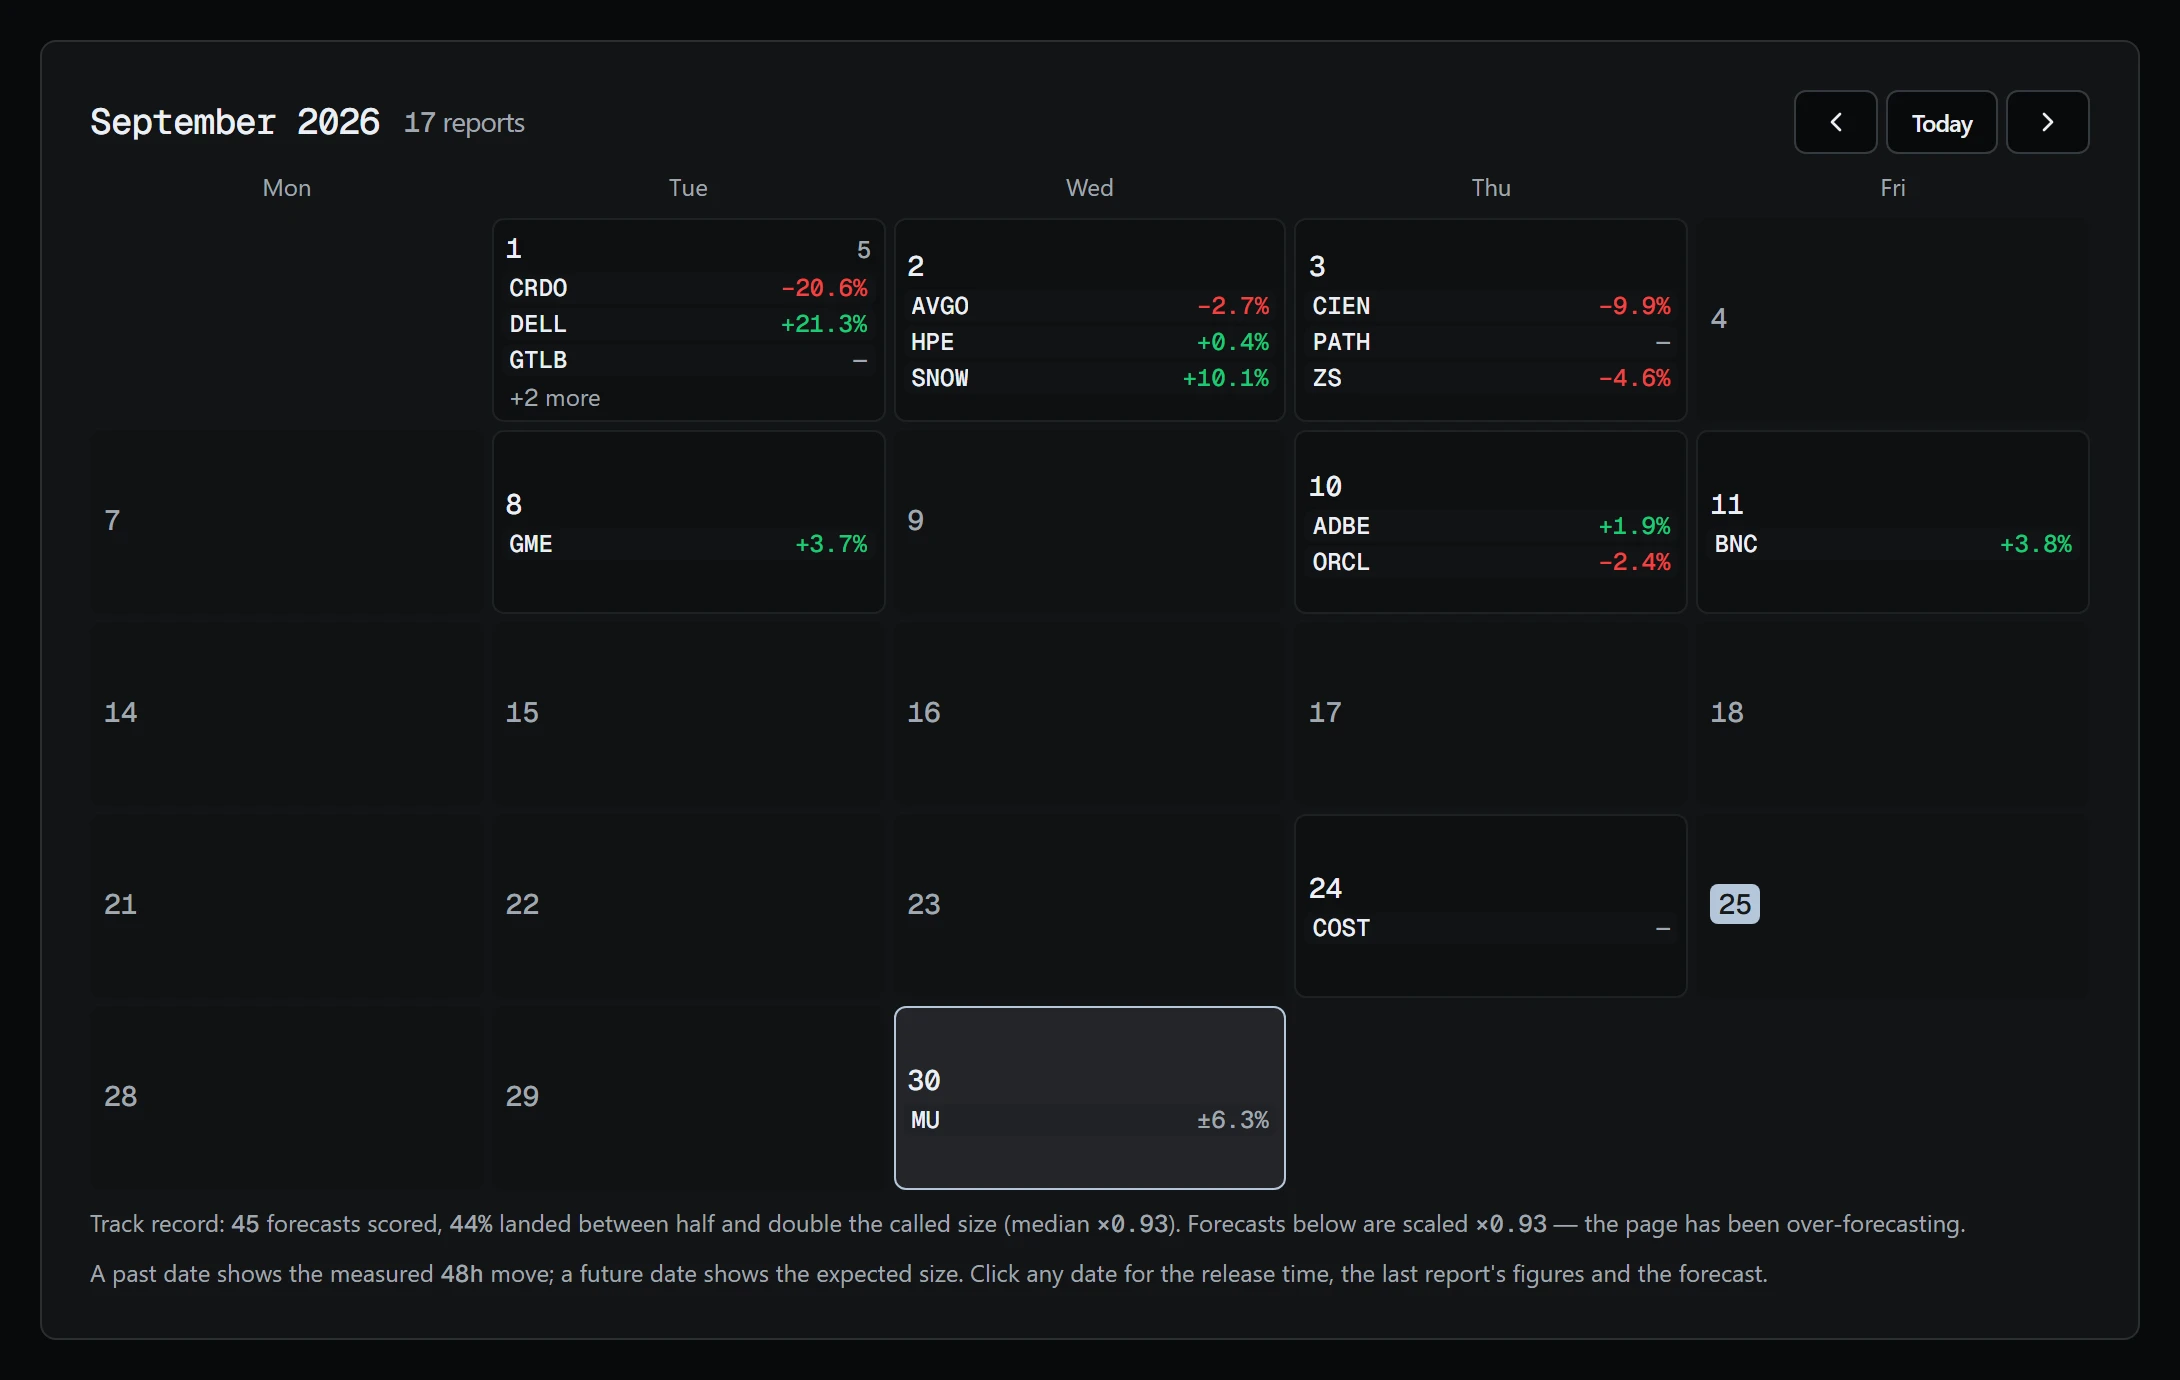
The data come from open sources that need no keys. Nasdaq supplies dates, sessions, the analyst consensus and actual earnings per share (EPS); Yahoo covers what Nasdaq lacks, such as Hong Kong, Korea and OTC stocks; hourly candles of Binance perpetual contracts give the price around a report. The export runs hourly and the calendar spans 120 days ahead and half a year back. Funds and commodity contracts, which have no quarterly reports, are excluded with the reason recorded.
An earnings report is the main scheduled event for a stock, and the price often moves harder than usual afterwards. The calendar shows how past reports moved the price: the change after 6, 24, 48 and 72 hours on Binance candles, the peak of the move and a comparison with the stock's usual two-day swing.
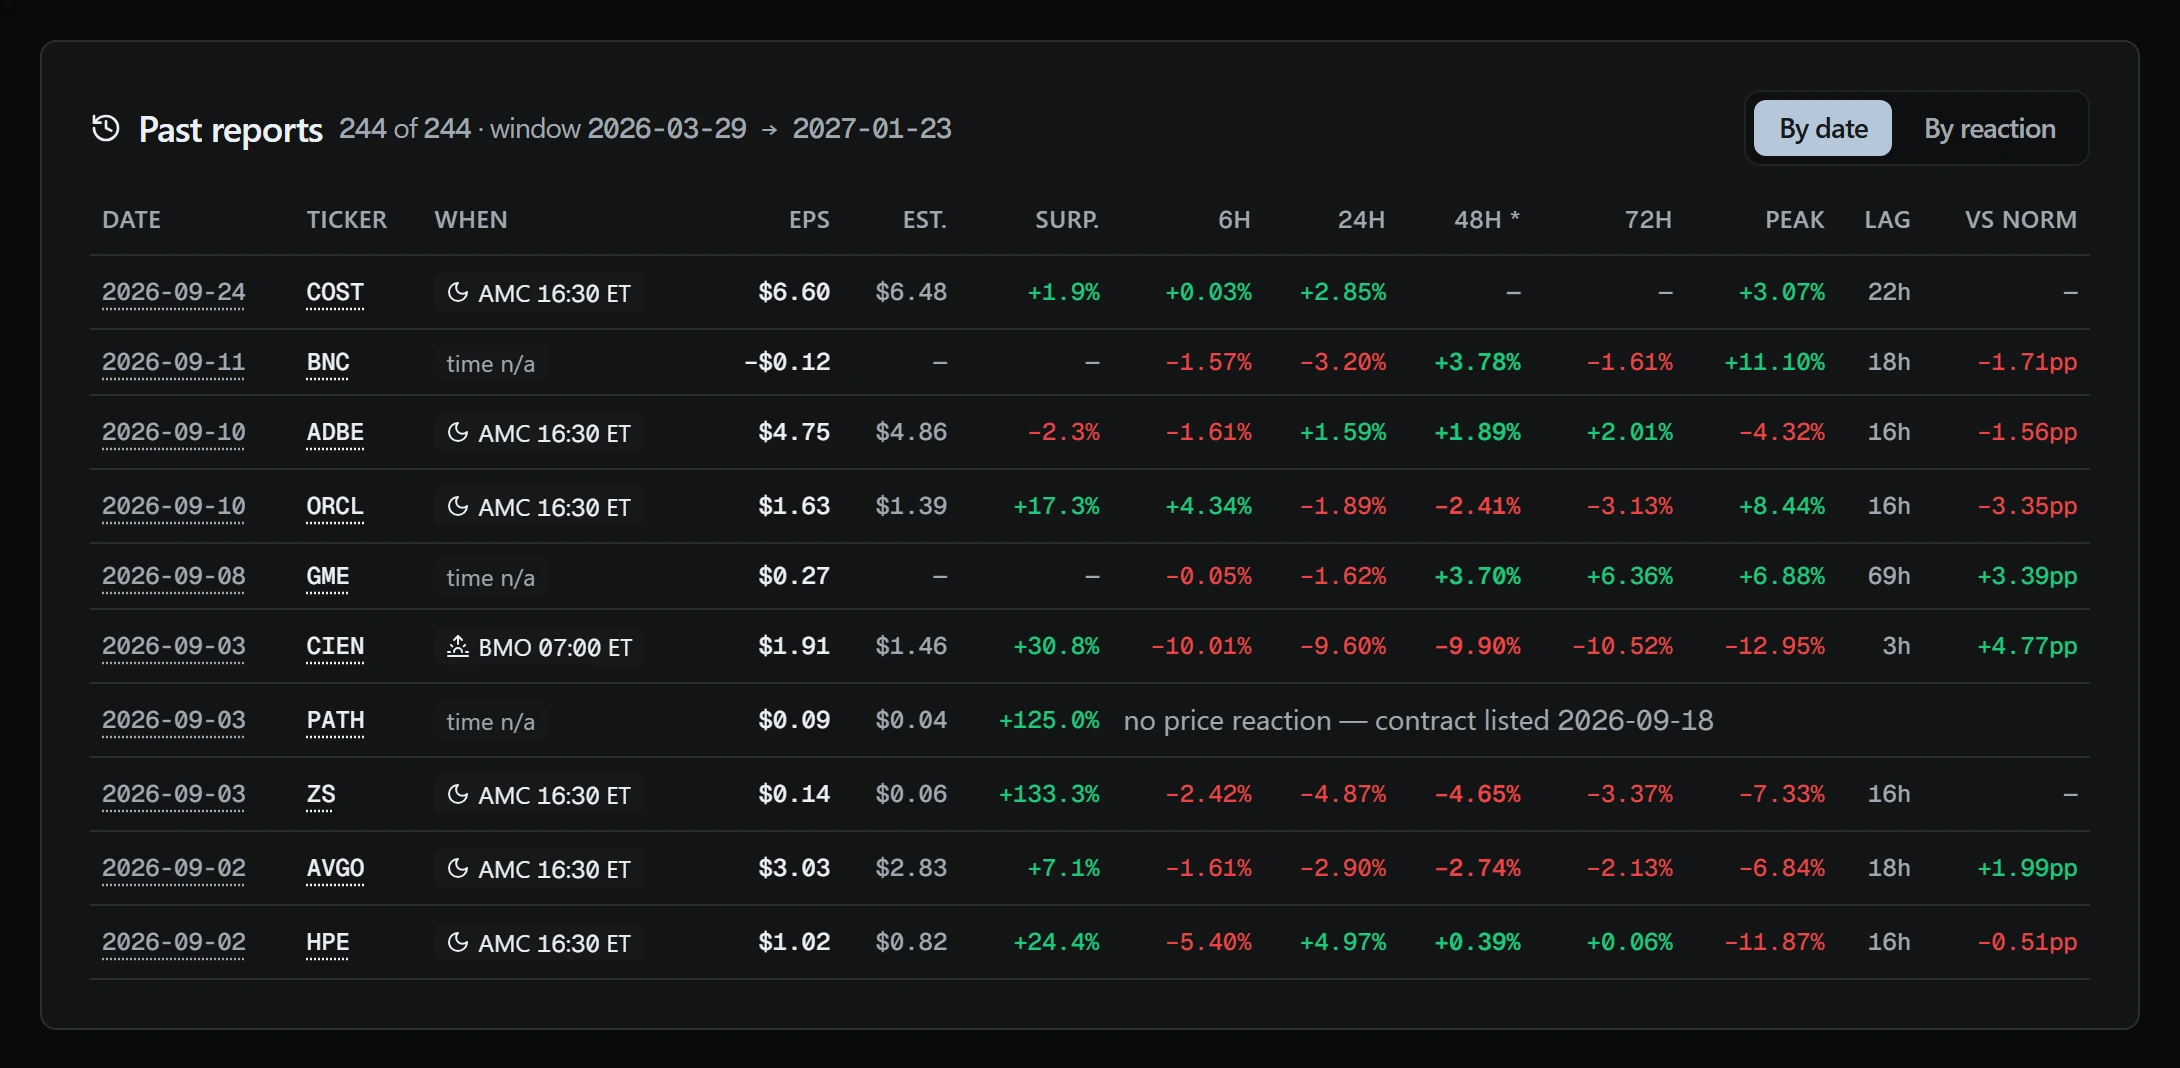
The sources give no exact release hour, and the site does not invent one. A report is marked before the open (before 9:30 New York time), after the close (after 16:00) or time n/a. The reaction is measured from a conventional moment: 7:00 for pre-market reports, 16:30 for after-close ones. Prices come from Binance contracts that trade around the clock, so the reaction shows even at night. Date estimated means the source estimated the date and the issuer has not confirmed it.
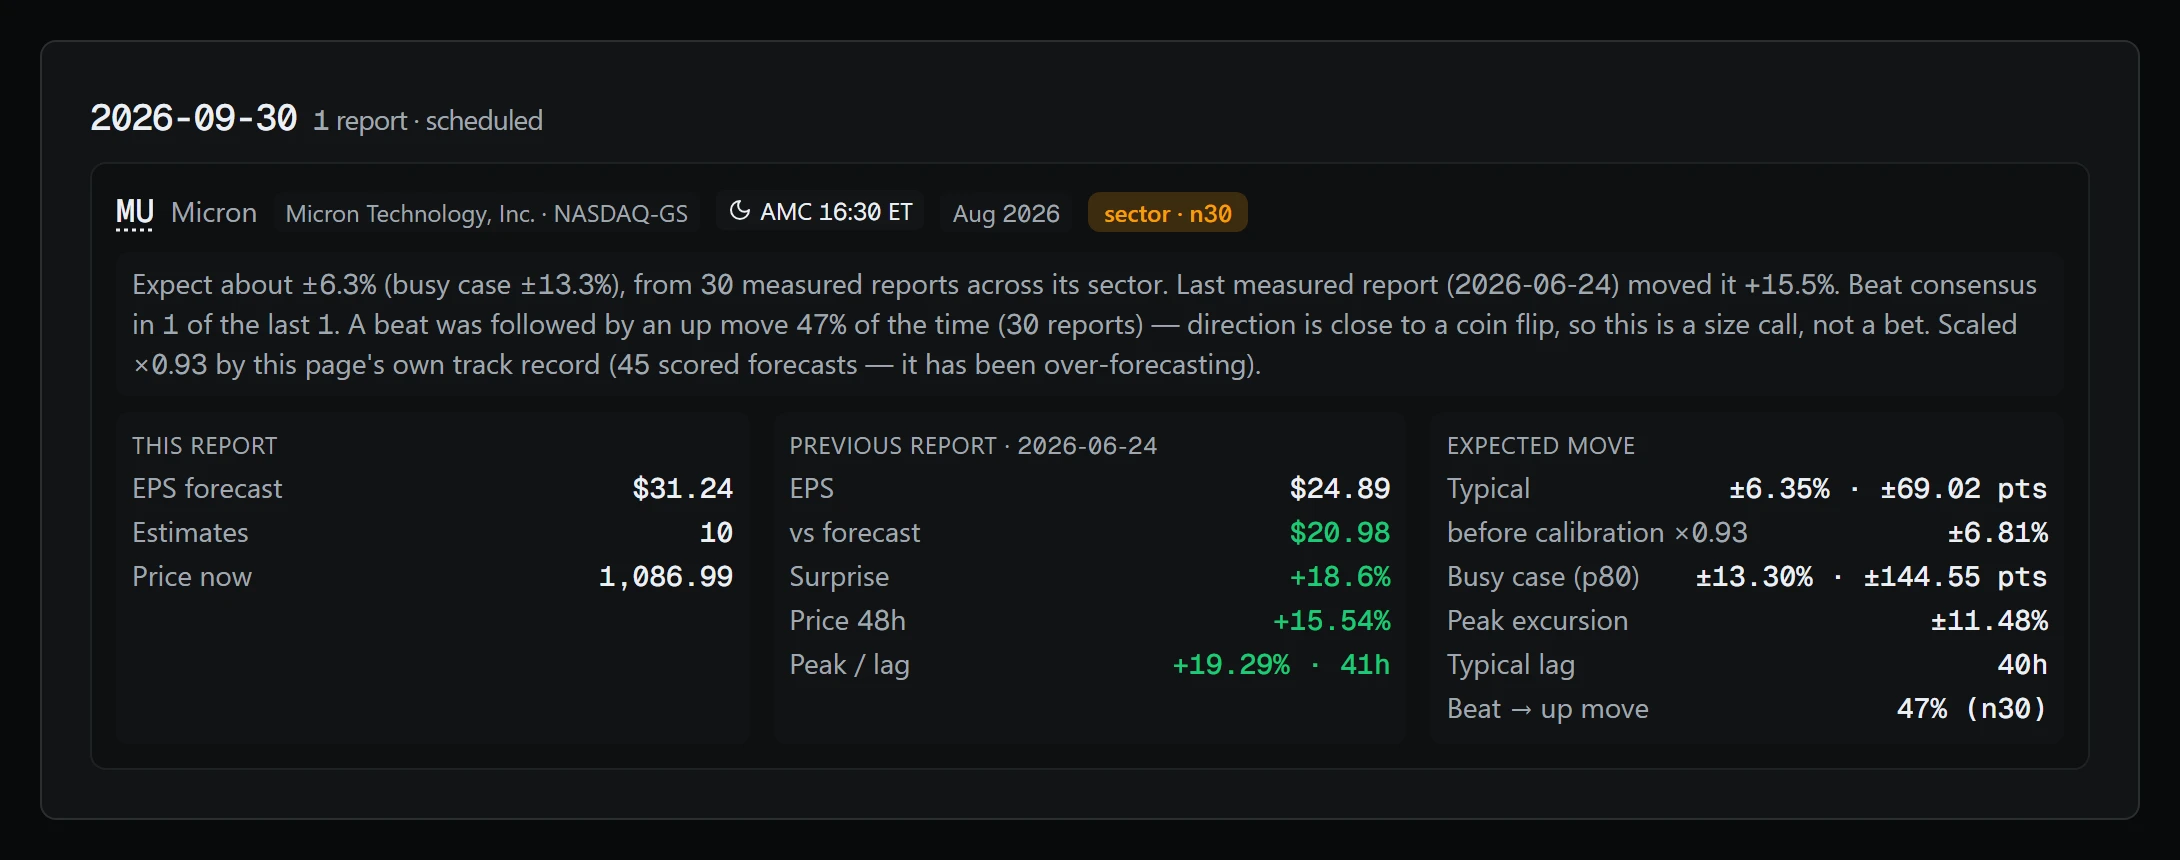
For upcoming reports the section estimates the size of the expected move — from the company's own history, its sector or the whole list — and always states how many reports the estimate rests on. It forecasts the size of the move, not its direction: which way the price goes after a report is close to a coin flip. Every forecast is recorded before the report and checked against the outcome afterwards, and those checks correct the next ones.
The size of the expected move follows a ladder: the company's own history if at least three reports are measured, then its sector from five, then the whole list from ten. With less data no forecast is shown and the mark no sample appears. The estimate rests on the median absolute move over 48 hours. A correction to later estimates starts only after five scored forecasts and stays within 0.5 to 2.
A shortened version is open without signing in at /en/earnings-calendar: US reports two weeks ahead and the latest ones with the 48-hour price reaction. The same list can be added to a calendar app via /earnings-calendar.ics, with the session in each event title. Hong Kong and Korea are not in the public calendar. The dashboard adds 120 days ahead, half a year of history, the 6–72 hour reaction, the peak move and the expected size.
The calendar shows in advance which stocks report during the week, to compare with how they behaved after past reports. Samples for one company are small, so the number of reports behind an estimate always sits next to it. It describes the size of a move, not its direction, and is not investment advice. Trading contracts on stocks carries a risk of losing money.