Earnings: surprise and price move on one map
Platform ·
How the price reacted to reports that beat or missed the forecast, as dots on a map, and the expected move before a report as a range from typical to stormy.
Above the past reports in the calendar there is now a map. Across is the earnings-per-share surprise against the analyst consensus, up the side the price move over 48 hours. Coloured dots are reports where the signs matched: earnings beat and the price rose, or missed and the price fell. Grey dots are where the market went against the number. The header gives the share of matches, and clicking a dot opens that report's day in the calendar.
The map and the forecast live in the dashboard, on the Earnings tab of the Market section. The public /earnings-calendar page shows two weeks ahead and the latest reactions, without a move forecast. Dates, EPS, consensus and surprise come from the Nasdaq calendar and surprise table, for some stocks from Yahoo, and prices from Binance candles on the TradFi contracts. The data refreshes hourly.
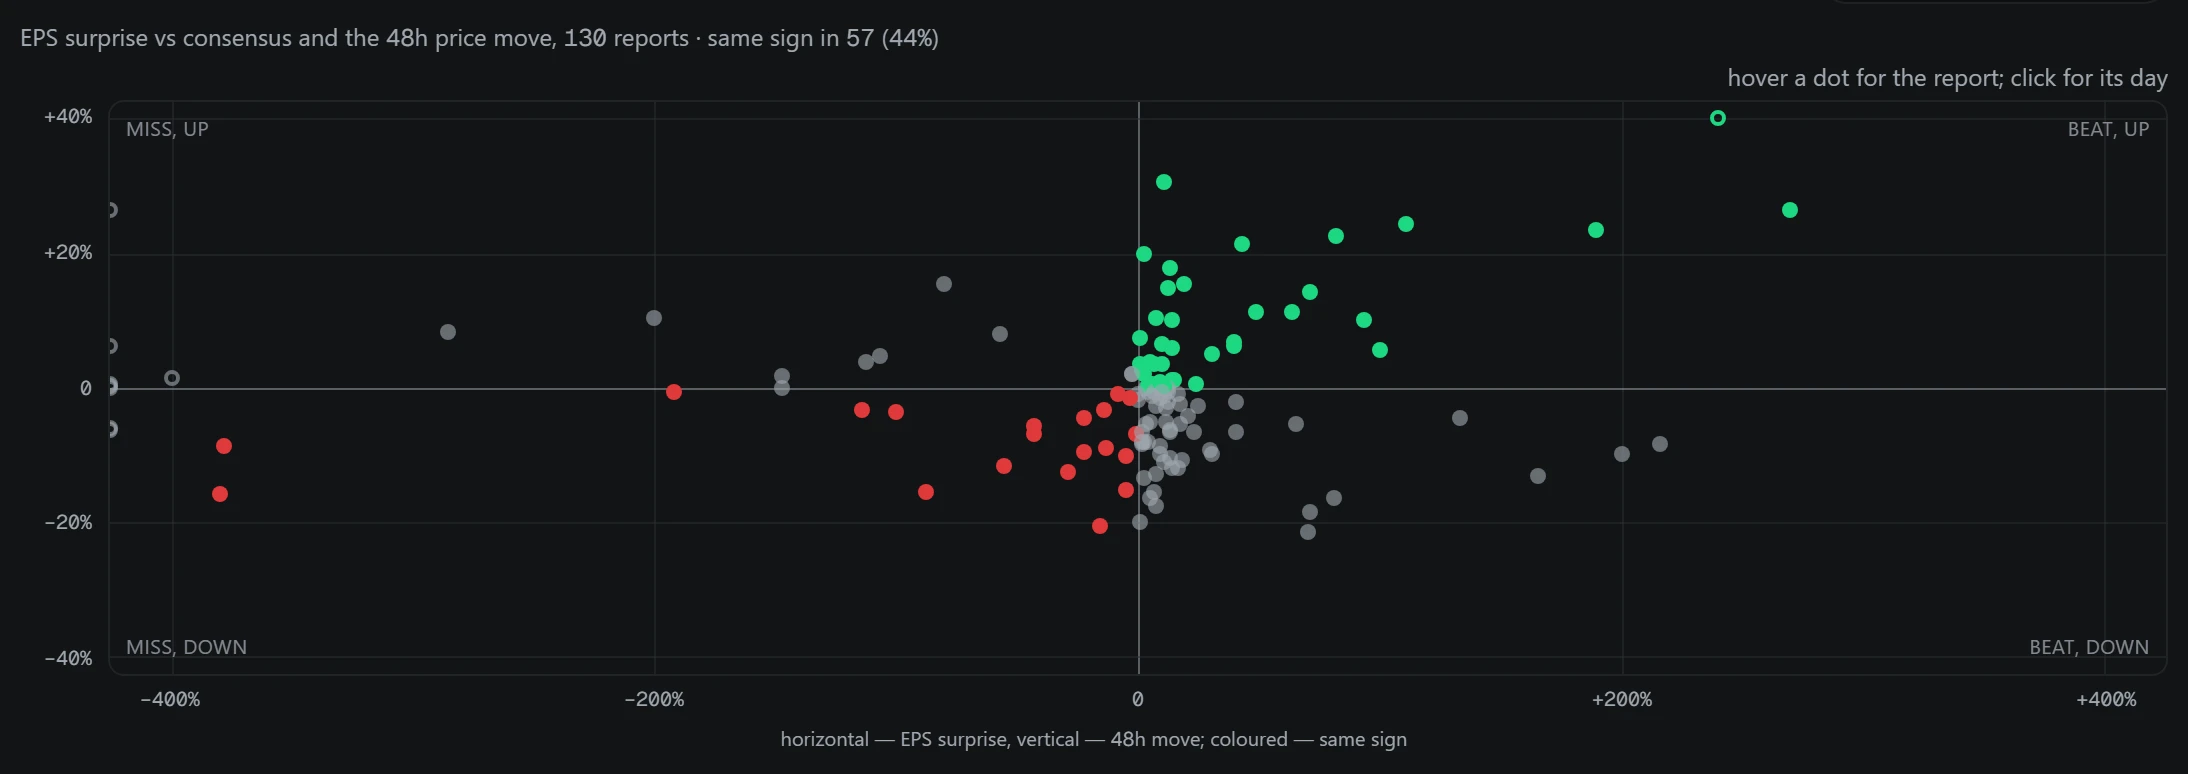
The map is built from reports with both a surprise and a price move; with fewer than five it is not shown. The move is measured over 48 hours from the price at the moment of the report. The axes are clipped at the 96th percentile so one outlier does not flatten the rest, and the corners are labelled: beat and up, miss and down, miss but up, beat but down. The table below also shows 6, 24, 48 and 72-hour moves; with no price, it gives the reason.
The map makes plain what the section is built on: a beat is far from a guaranteed rise. That is why the calendar estimates the size of the move after a report, not its direction.
The share of matching signs is not a forecast: when it is close to half, the direction of the move is barely predictable from the number, like a coin flip. The map and the expected move describe past price reactions and are not investment advice; trading stocks and contracts on them carries a risk of losing money.
The expected move for upcoming reports is now drawn on an axis centred on zero: the thick bar is the typical move, the thin line a stormy case (the 80th percentile), the ticks the typical peak, and the dot the move after the previous report. The track record shows as a bar the share of past forecasts that landed between half and double the stated move.
The expected move is the median of the absolute past moves over 48 hours. The ticker's own reports are used if at least three are measured; otherwise its sector, if at least five; otherwise the whole TradFi set, if at least ten. If there is no data anywhere, the forecast stays empty: the size of the move is unknown, not small. The basis and the sample size are stated in the comment on the report.
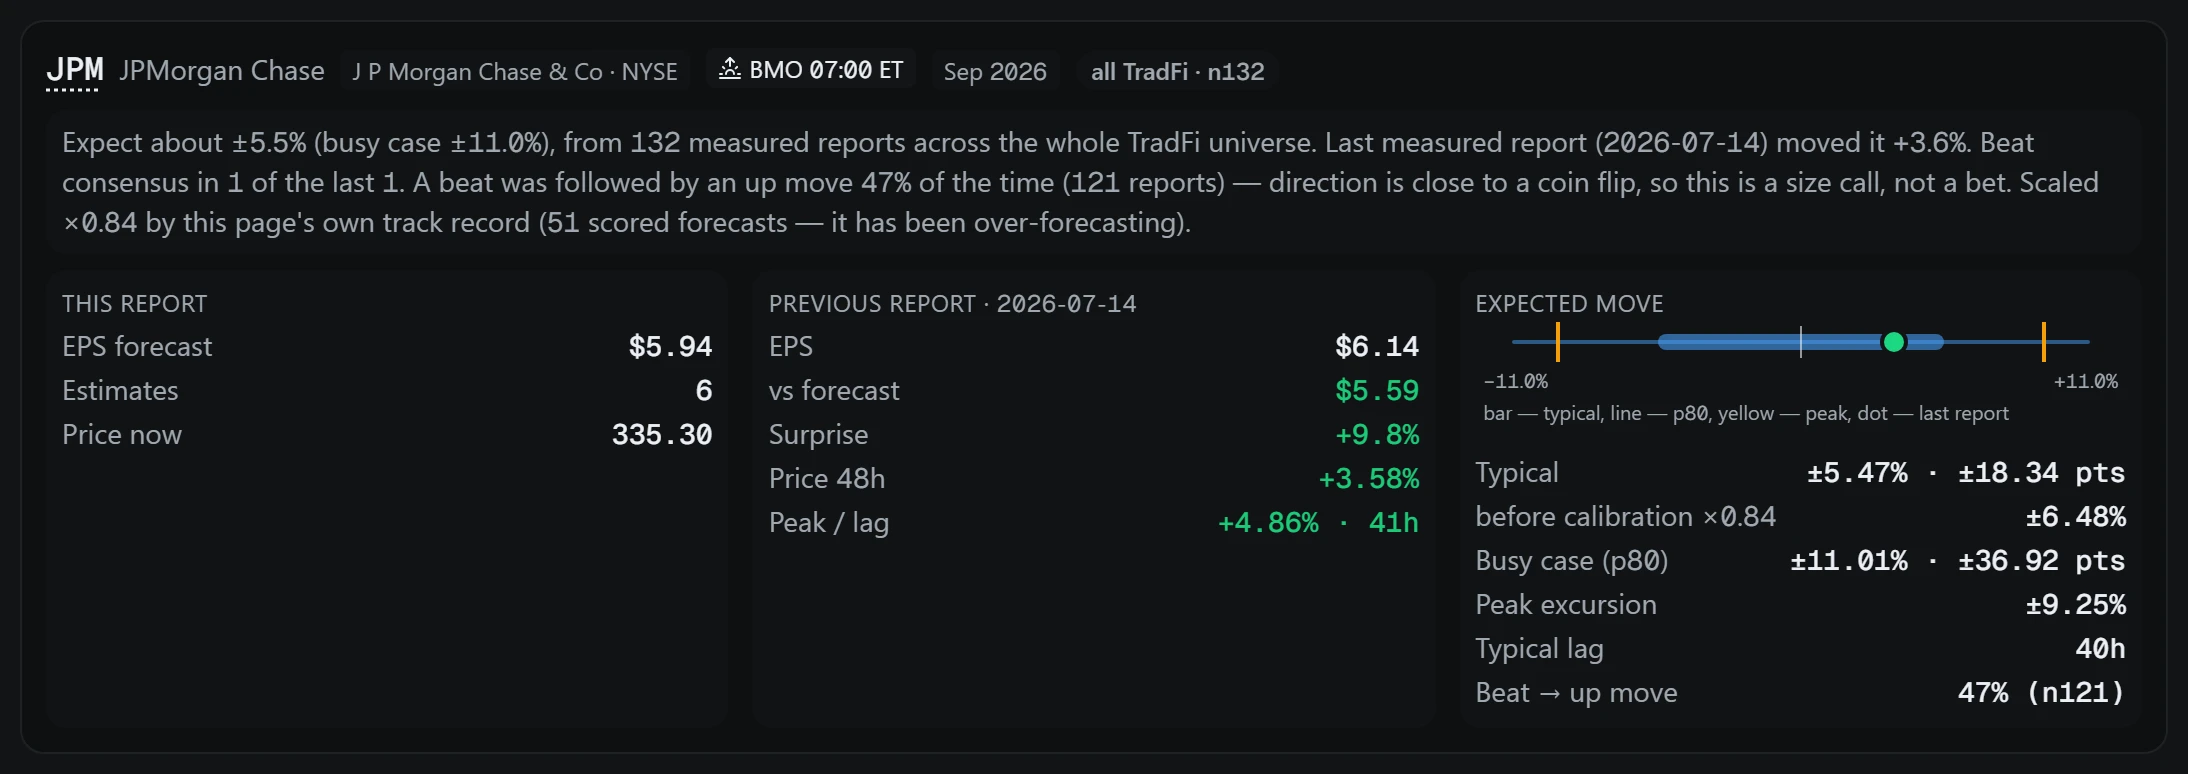
Each forecast is saved before the report and compared with the outcome afterwards. The track record shows how many forecasts have been scored and what share landed between half and double the stated move. Once enough are scored, forecasts are scaled by the page's own history, and the correction is shown beside them.
Coverage is limited to issuers whose contracts exist in TradFi: funds, commodities and securities without quarterly results are excluded, and the reason is recorded. If the release time is not announced it is marked unknown, and a date the source only estimates is marked as an estimate. The calendar window runs up to 120 days ahead and 180 days back.