Five managed directions: metals, oil and crypto
Market ·
Precious metals, traditional markets, oil, bitcoin and ether — how capital is allocated.
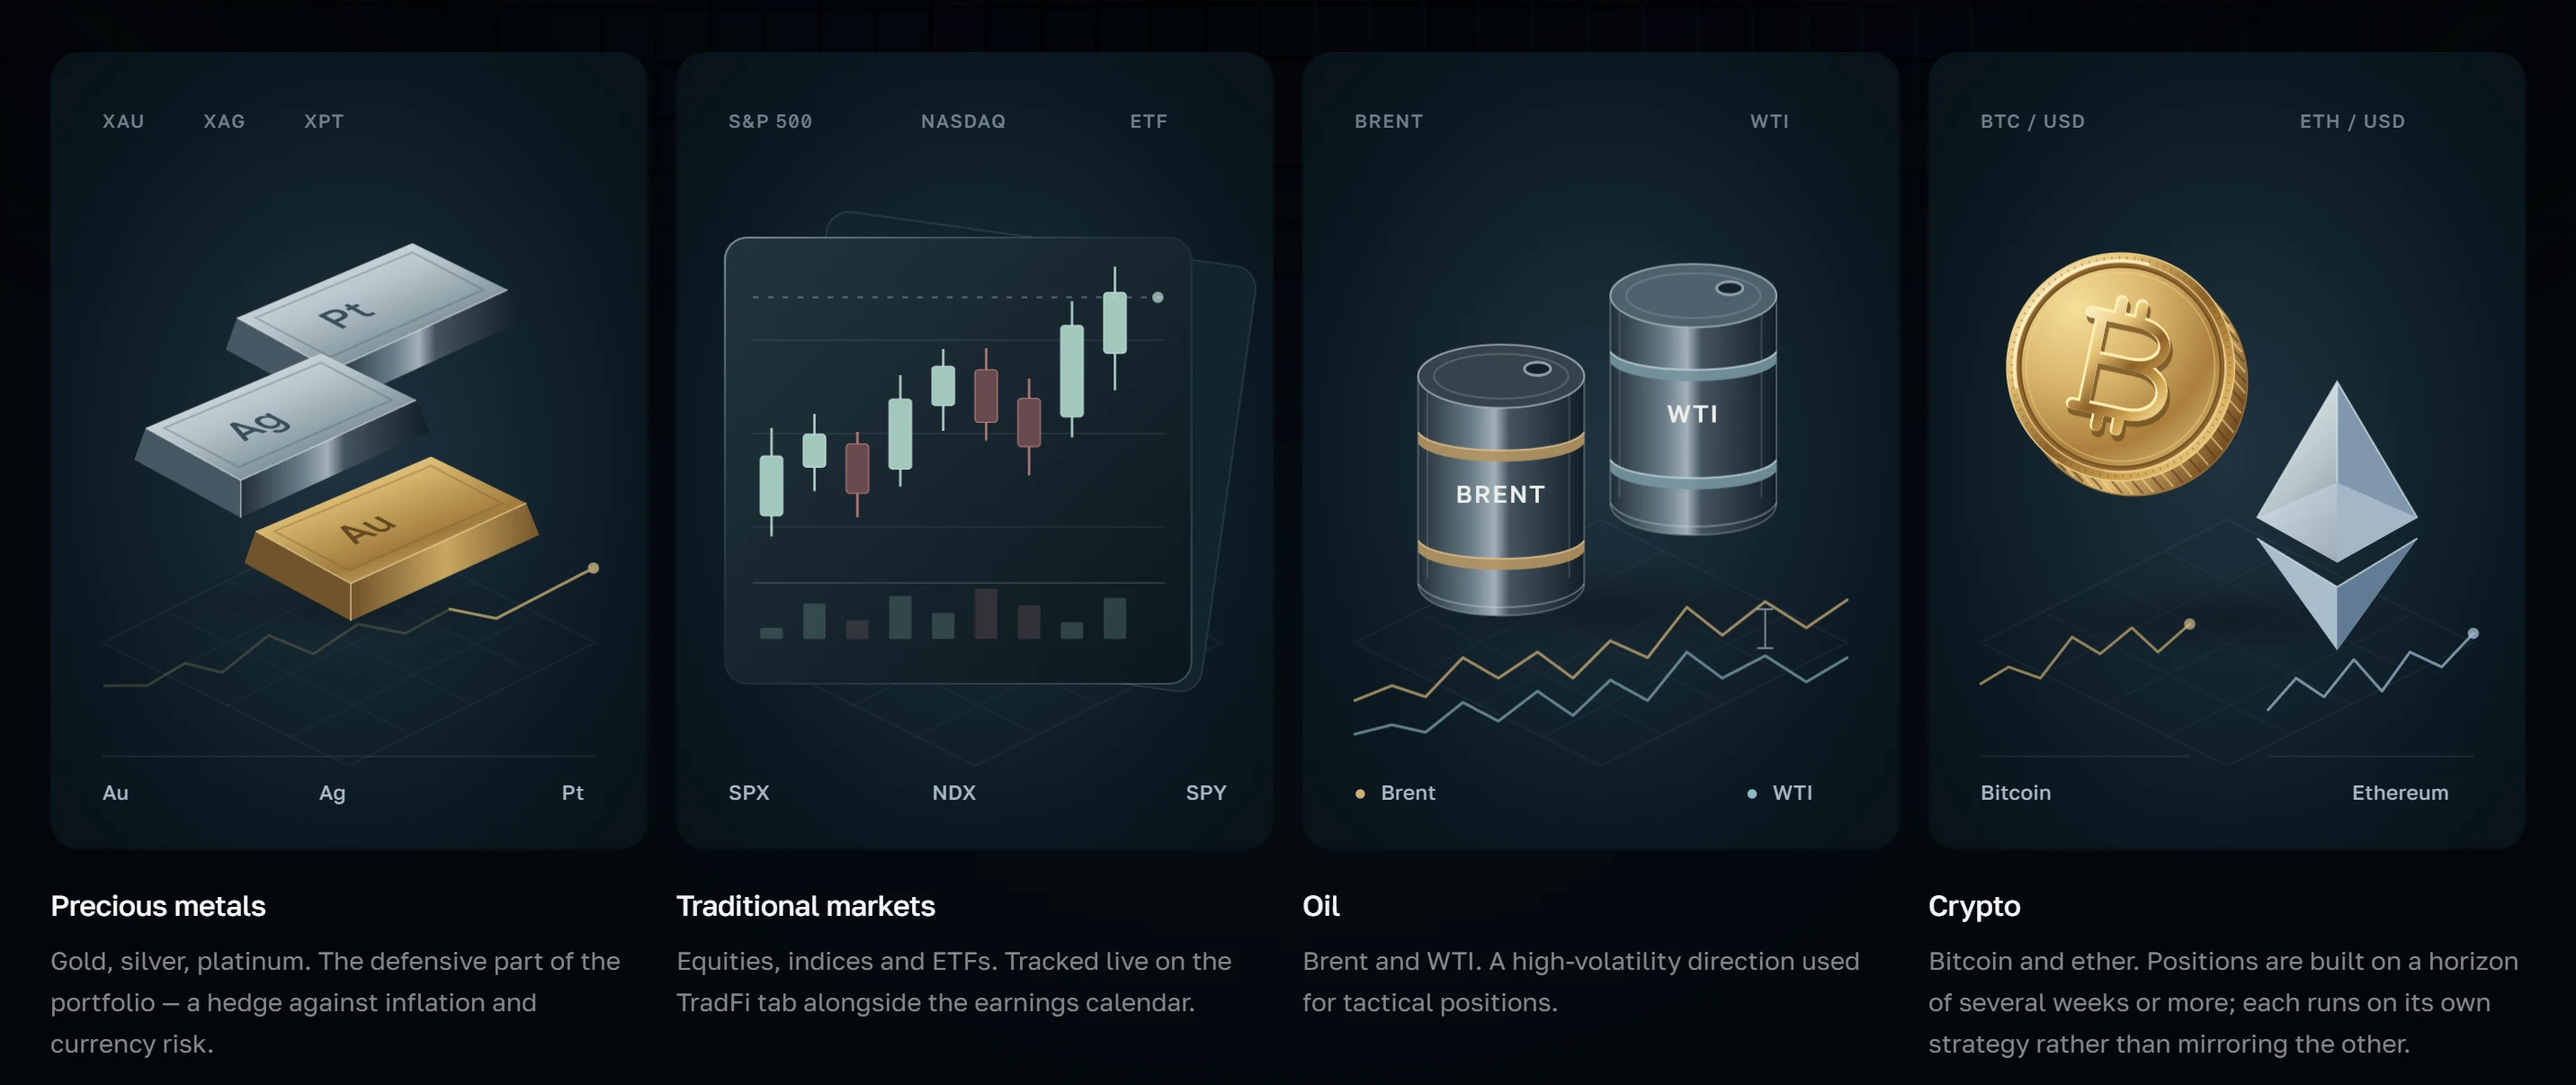
Capital is allocated across five asset classes. Metals carry the defensive part of the portfolio, traditional markets cover stocks, indices and ETFs, and oil is used for tactical positions because of its volatility.
On the site, each direction stands for specific instruments. Precious metals are gold, silver and platinum. Traditional markets are stocks, indices and ETFs, followed on the TradFi tab together with the earnings calendar. Oil is Brent and WTI. Bitcoin and ether are run separately.
Bitcoin and ether run on separate strategies: the second does not mirror the first, otherwise the two would behave as a single double-sized position.
According to the site, bitcoin and ether positions are built on a horizon of several weeks or more, and each asset has its own strategy. The Strategies section groups instruments in a similar way: Crypto, TradFi and Resources, which holds metals and oil. It shows one strategy per instrument, and the result of each is a backtest on history since 2023, not the outcome of a managed account.
In every direction the trades are made only by the manager: a client does not open trades on the platform. The feed is built from the Binance API — positions on USDⓈ-M futures are assembled from real executions, and entry and exit prices come from there too. The result in the feed is a percentage of the position's margin, that is with leverage: at 50× leverage a 1% price move gives 50% on margin, in profit or in loss. It is not a percentage of the client's account.
Above the trade list the dashboard calculates a summary for the chosen period: the number of closed trades, the share of winners excluding breakeven, the average result per trade on margin, the profit factor, the best and worst trade, and the average hold. The period is a week, a month, a quarter, half a year or a year by close date, and open positions are not included. The summary covers the trades shown in the dashboard and does not reflect the result of any particular account.
The directions show up in the dashboard in several places. The All trades tab groups results by instrument: the average trade result and the number of trades. The Charts tab is split into Crypto and TradFi. The TradFi tab follows non-crypto perpetual contracts on Binance, the earnings calendar covers stocks, the Liquidations section belongs to the crypto market, and the US economic calendar touches all directions at once.
The US economic calendar measures the market's reaction to releases on one instrument per direction: bitcoin, ether, gold, WTI crude and the S&P 500 index. All five are perpetual contracts on Binance with a round-the-clock price feed. This shows on one screen how the same publication acted on different asset classes. It is an observation of the past, not a signal.
Spreading capital across asset classes does not rule out losses: each direction has its own risk, and leverage amplifies the result in both directions. Operations on financial markets carry a risk of partial or complete loss of invested funds, and past results do not guarantee future results. This news item describes how the service is built and is not investment advice. To open an account you need to register; full access is given personally, after a conversation on Telegram.