New section: Liquidations — live feed and heatmap
Platform ·
Forced position closures on Binance, Bybit, OKX and Gate: a live feed, 90 days of history and a liquidation levels heatmap.
The dashboard now has a Liquidations section. A liquidation is the forced closure of a leveraged position: once the loss eats through the margin, the exchange closes the position at market. The section collects these closures from Binance, Bybit, OKX and Gate futures and shows them for the last hour, 4, 12 and 24 hours — by coin, by exchange, and split into longs and shorts.
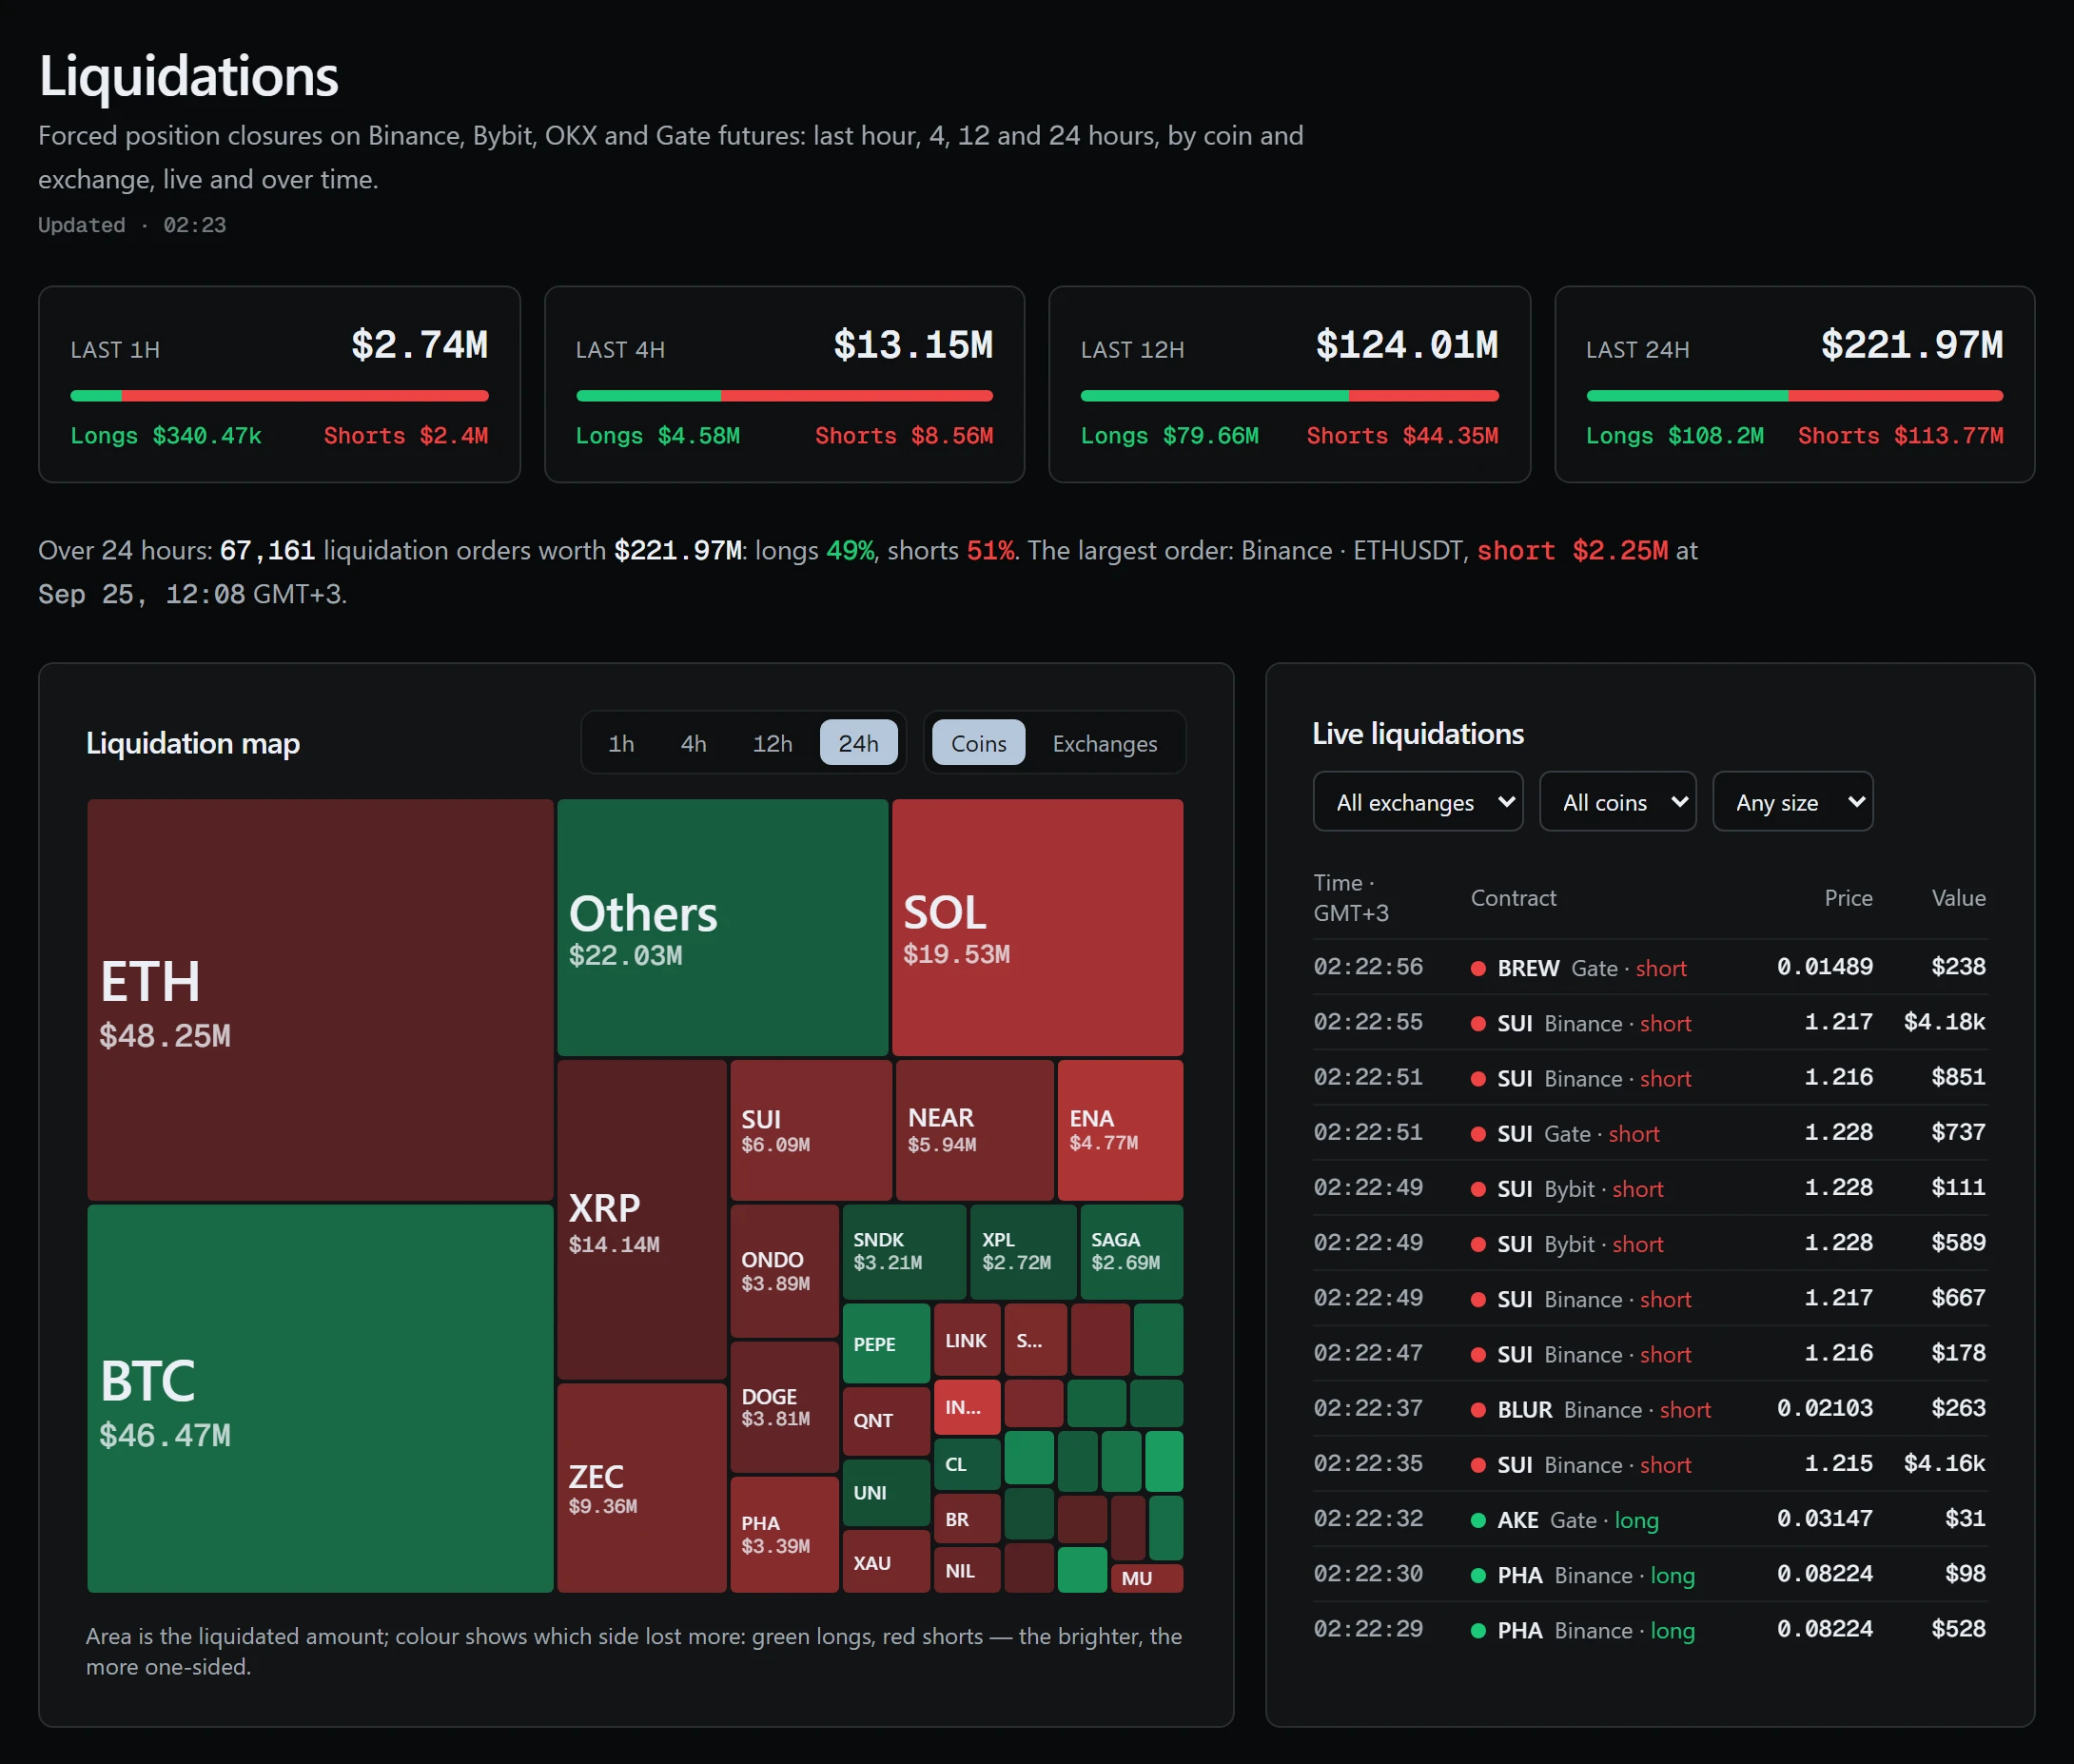
The site collects the data itself. It holds public WebSocket connections to Binance, Bybit, OKX and Gate and writes the accumulated liquidations to the database every two seconds. Exchanges name the side differently: Binance and Gate report the side of the order, Bybit the side of the position. In the section the side always means the closed position: a long is liquidated by a sale. Contracts are mapped to a coin without a multiplier, so 1000PEPE and PEPE count together.
These data have limits. Binance sends at most one liquidation per contract per second and the rest never reach the stream, so totals for that exchange may be understated in cascades. OKX delivers some liquidations late. Exchanges publish no liquidation history, so the section's history starts at the first run of the collector; while it is shorter than a window, the section says so in a separate line.
Liquidations fuel many of the sharpest moves in crypto. Forced closures execute as market orders: selling from liquidated longs pushes the price down into the next liquidations and the drop cascades; with shorts it works the same way, only upward. The section shows where this is happening right now and whose positions the market is flushing out. The feed refreshes every three seconds, with large orders highlighted.
The section takes each coin's price and daily change from Binance USDⓈ-M futures once a minute. While the tab is open, the feed asks for new orders every three seconds. It can be filtered by exchange, coin and minimum size, from one thousand to one million dollars. The largest order is shown above the feed with its exchange, ticker, side and time.
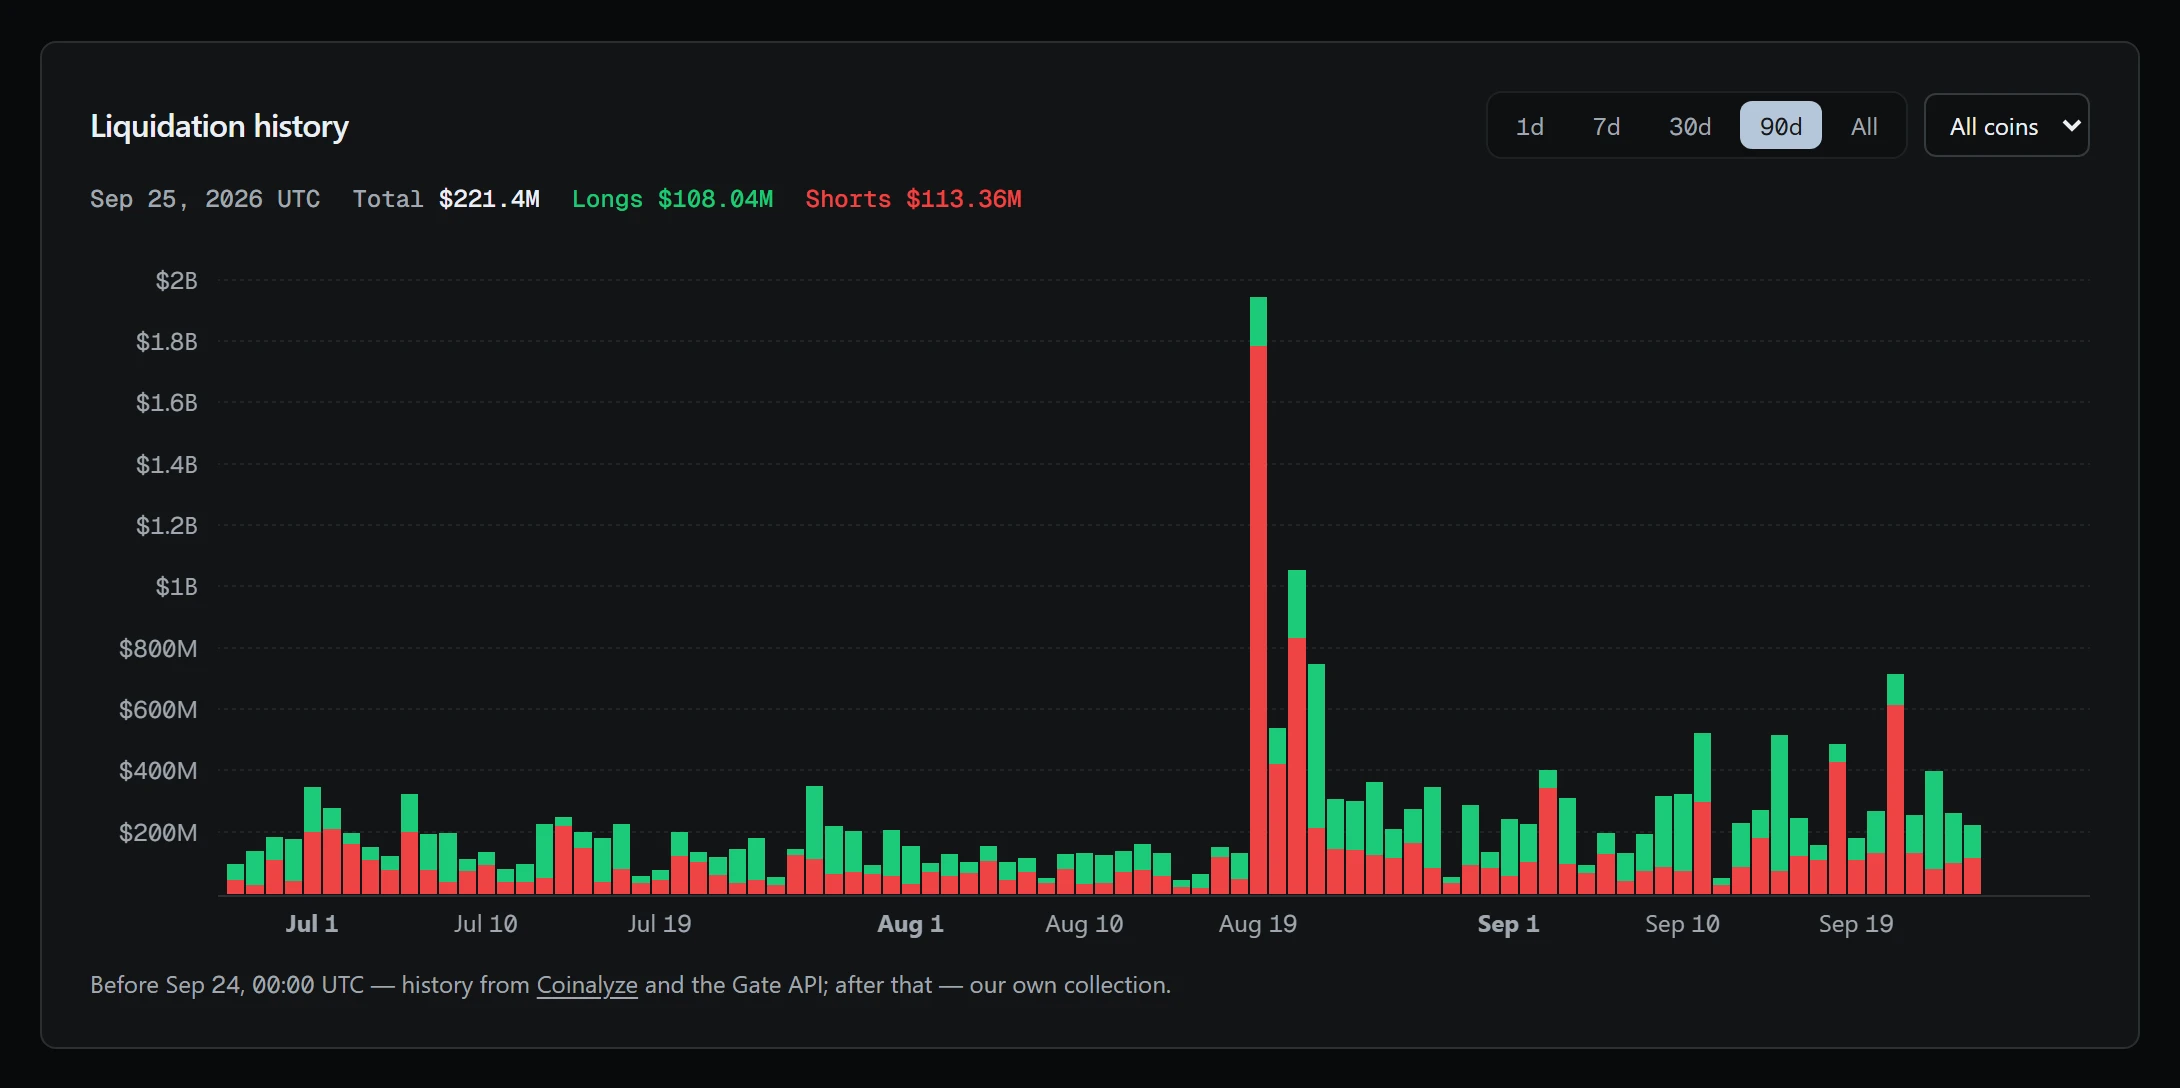
The 90-day history shows the market's most nervous days and which side took the main hit, across all coins or for a single one. The levels heatmap at the bottom of the section marks the prices where, by estimate, the most leveraged positions have piled up. It is a model built on Binance open interest, so treat its levels as zones rather than exact prices.
The history is built from hourly totals per exchange and coin, kept permanently, while the orders themselves are kept for a week. The period runs from a day to all time, with the step growing from 15 minutes to a day. The levels heatmap is computed by the liq-heatmap/2 model: growth in Binance open interest is split equally between longs and shorts and spread across leverage from 5× to 125×. The leverage shares are an assumption: the exchange does not publish them. The browser does the computing.
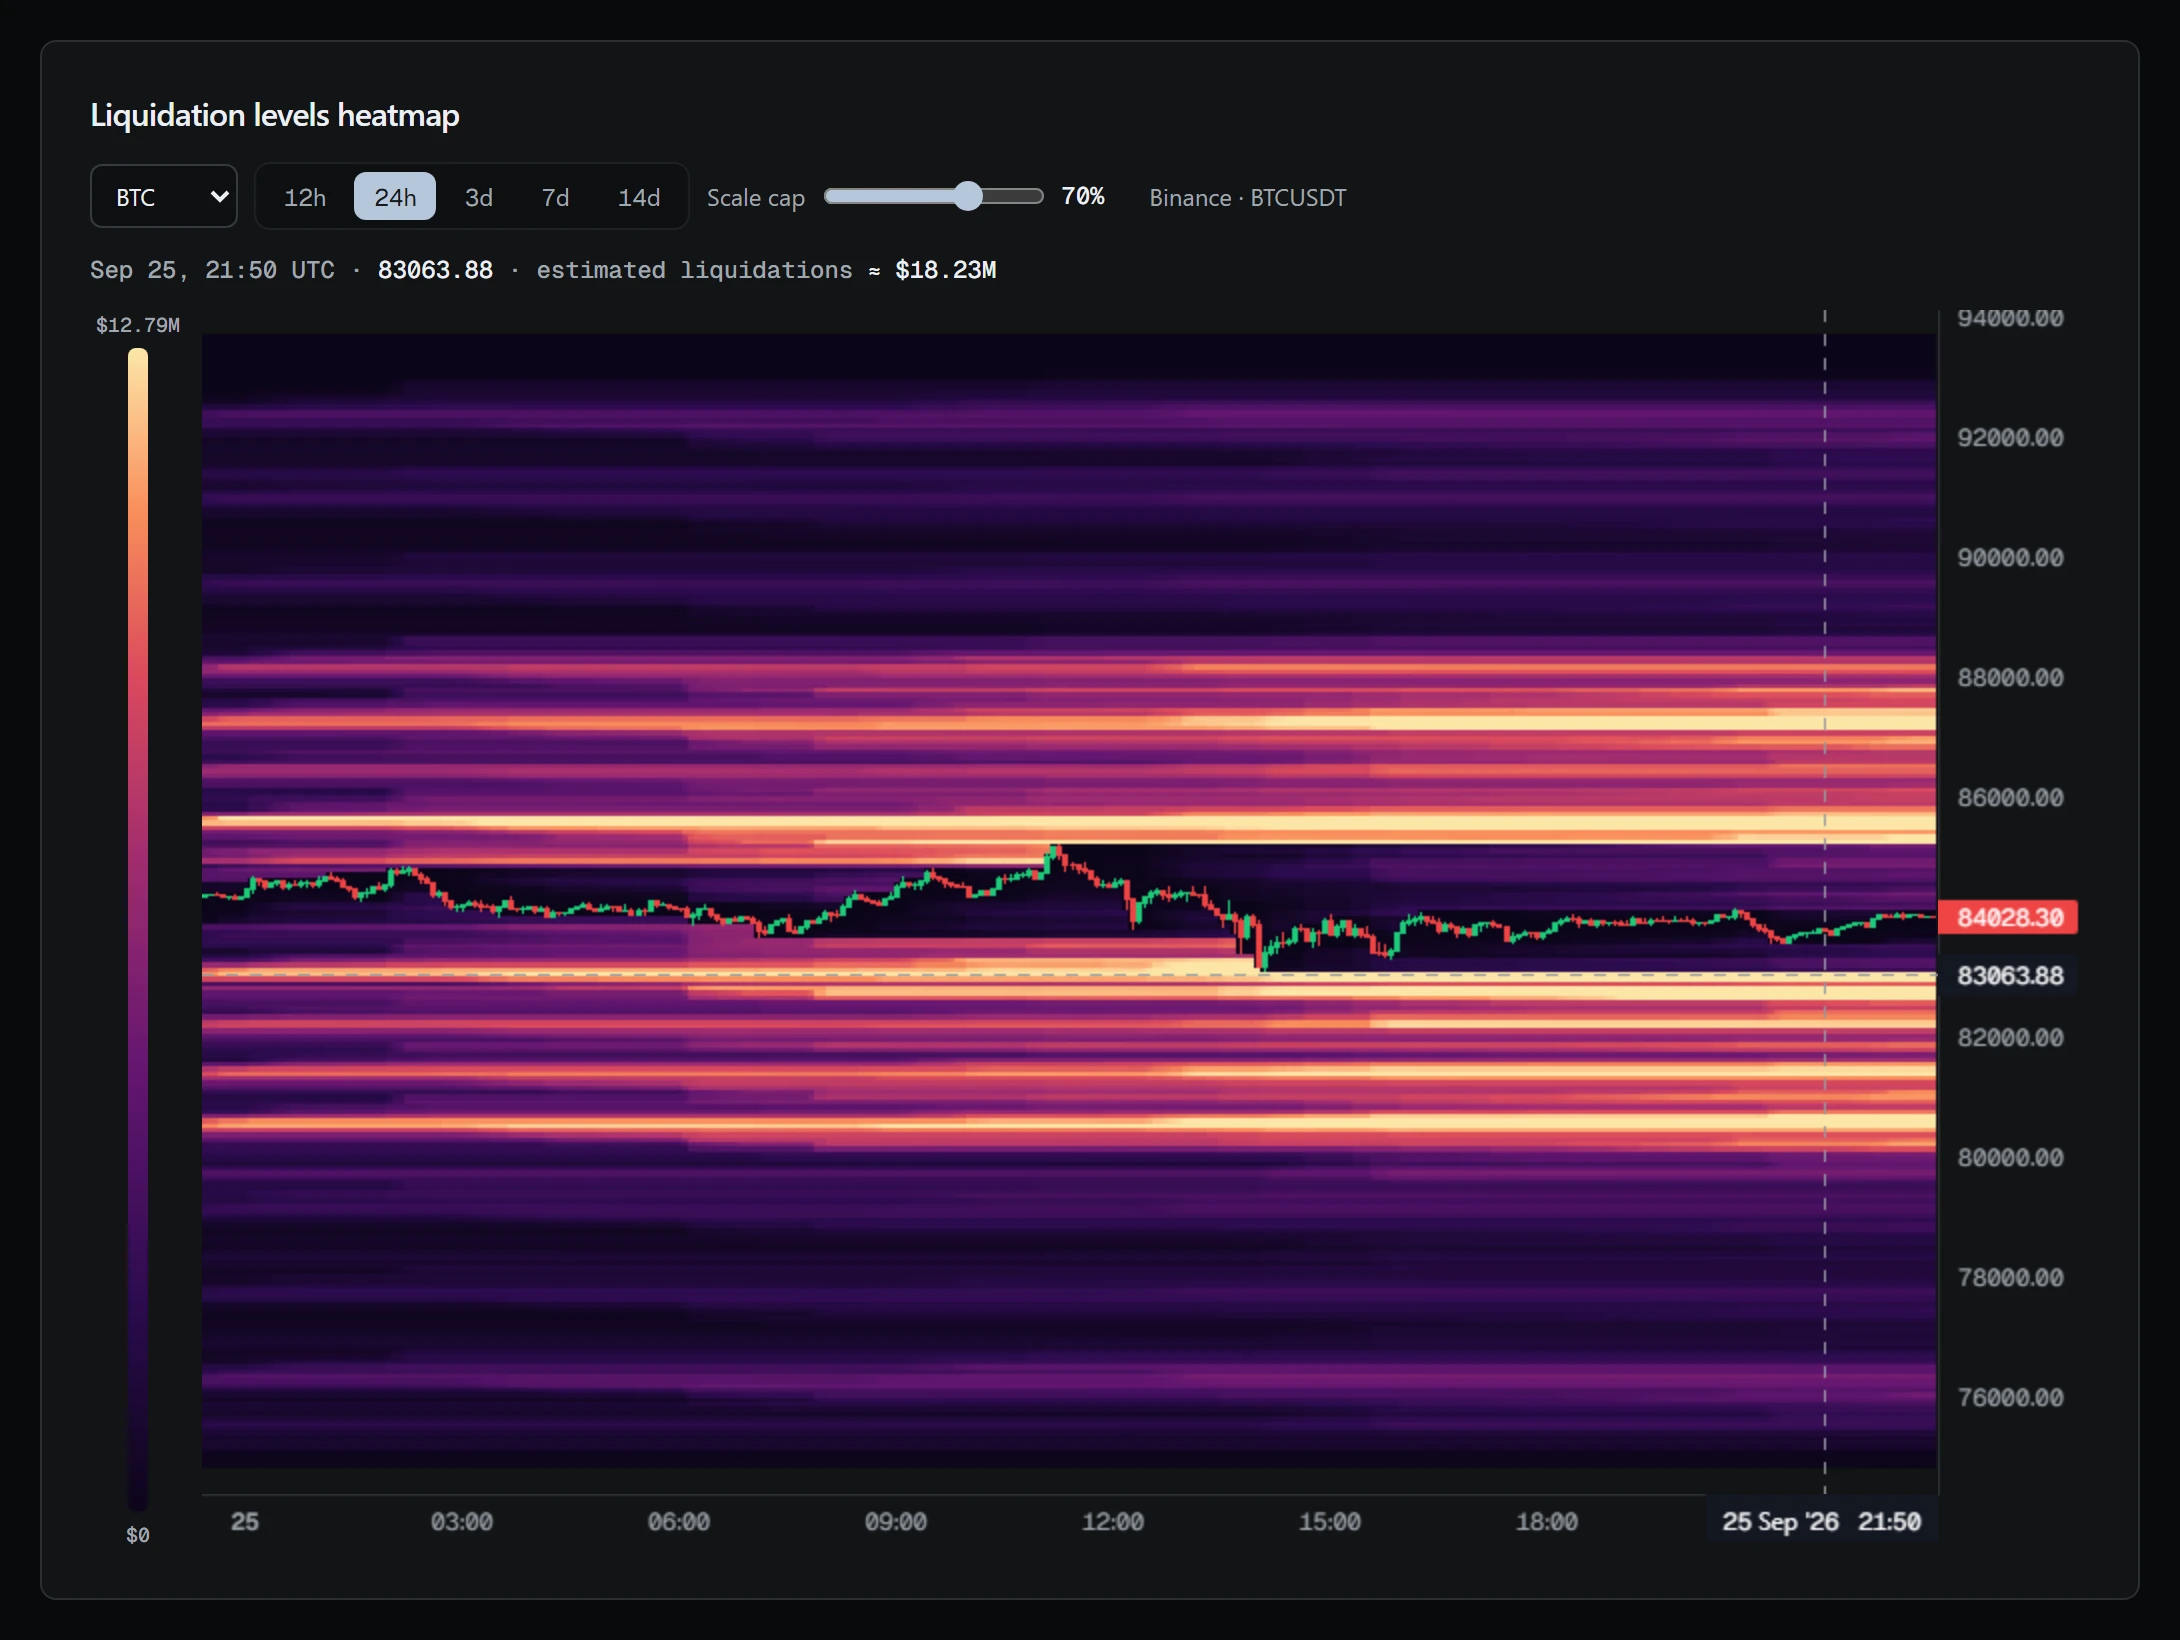
A shortened version is open without signing in at /en/liquidations: windows for 1, 4, 12 and 24 hours, the ten coins with the largest totals, exchanges, the BTC and ETH levels map with its method, and a liquidation price calculator. The feed, the history and the map for any coin stay in the dashboard. The calculator estimates for isolated margin, while the exchange computes the exact price. The section describes the market and is not investment advice. Trading with leverage carries a risk of losing money.