US economy: the market's reaction as a heatmap
Platform ·
Which releases move bitcoin, ether, gold, oil and the S&P 500 the most, in one grid, and the reaction to each release as bars from 15 minutes to a day.
The How the market reacts summary in the economic calendar is now a heatmap: nine indicators as rows, five instruments as columns. Each cell holds the typical price move in the hour after a release, and its colour shows how many times larger that is than the move in the same hour a day earlier. A grey cell means the release moves the market no more than an ordinary hour, a bright one four times or more. Clicking a cell filters the past releases down to that indicator.
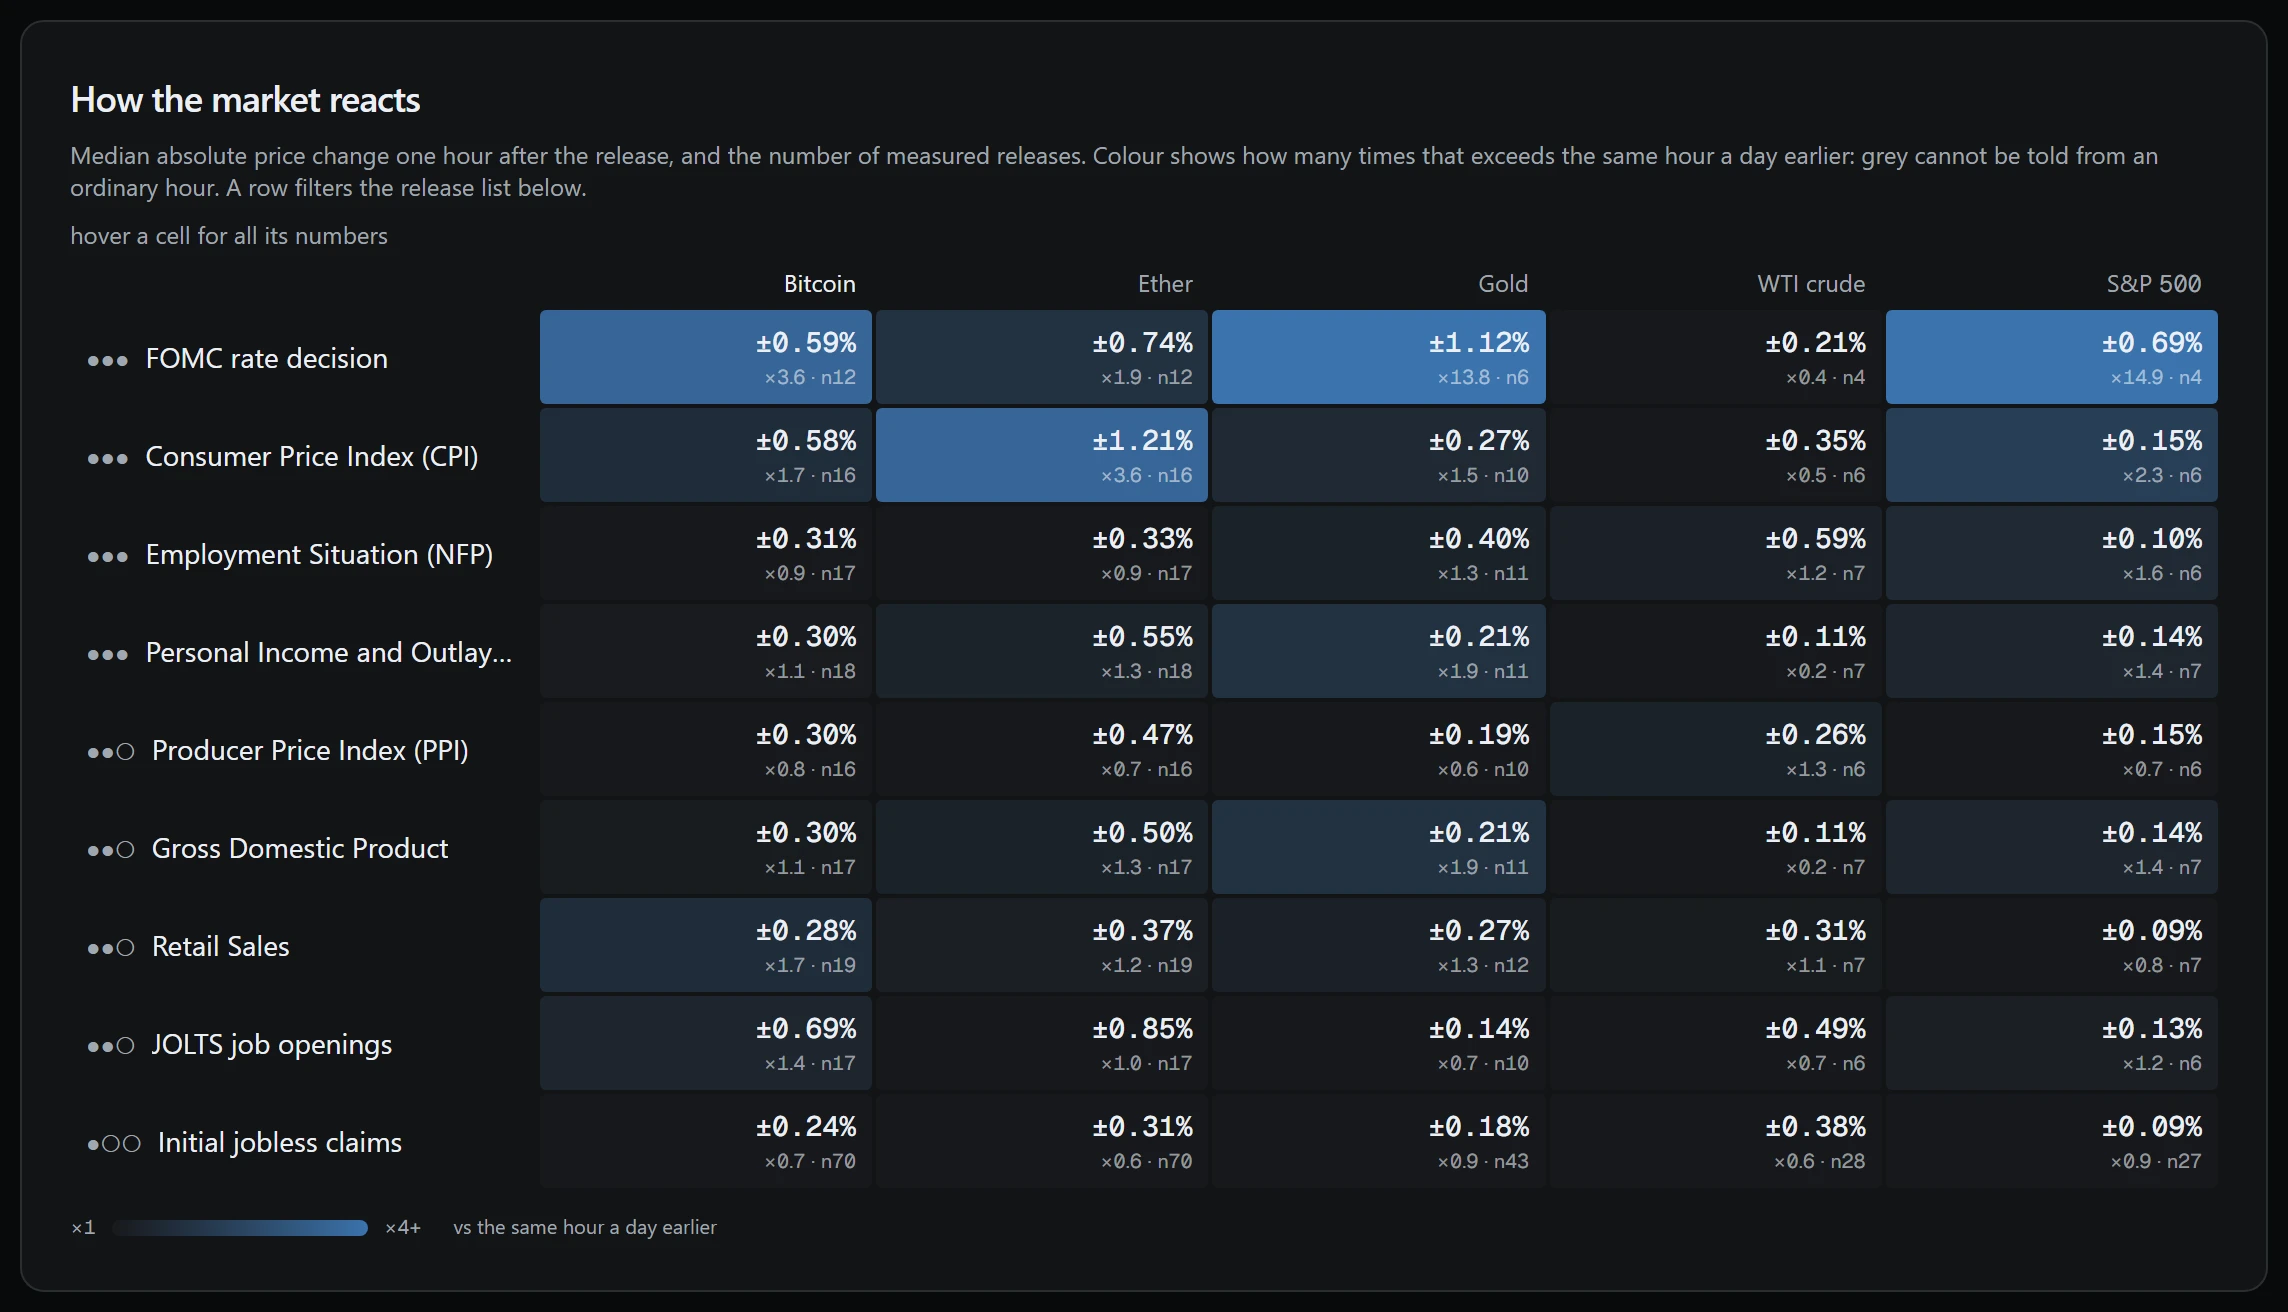
Each cell holds three values: the median one-hour move in absolute terms, how many times it exceeds the move in the same hour a day earlier, and the number of releases measured, marked n. The comparison uses the same hour of the day, not the hour before the release, because the morning before a release is usually quiet and would exaggerate any reaction.
The US economy section of the dashboard is a calendar of nine indicators: the Fed rate decision, consumer prices (CPI), the labour market (NFP), consumer spending (PCE), producer prices (PPI), GDP, retail sales, JOLTS job openings and initial jobless claims. Dates and values come from FRED, the St. Louis Fed database, and Fed meeting dates from federalreserve.gov. Each value is taken from the data version of the publication day, before later revisions.
Reaction is measured on bitcoin, ether, gold, WTI crude and the S&P 500. All five are Binance perpetual contracts with five-minute candles. The price before a release is the close of the candle before it, compared with the closes 15 minutes, an hour, 4 hours and a day later. If candles are missing, the result is a gap, not a zero: not measured and did not move are different facts.
For an upcoming release, each instrument shows the usual one-hour move stretching out to a large one (the 80th percentile), a tick for a quiet hour with no release and the typical 4-hour peak. Next to it is how often the price rose and fell when the figure came in above or below the previous one.
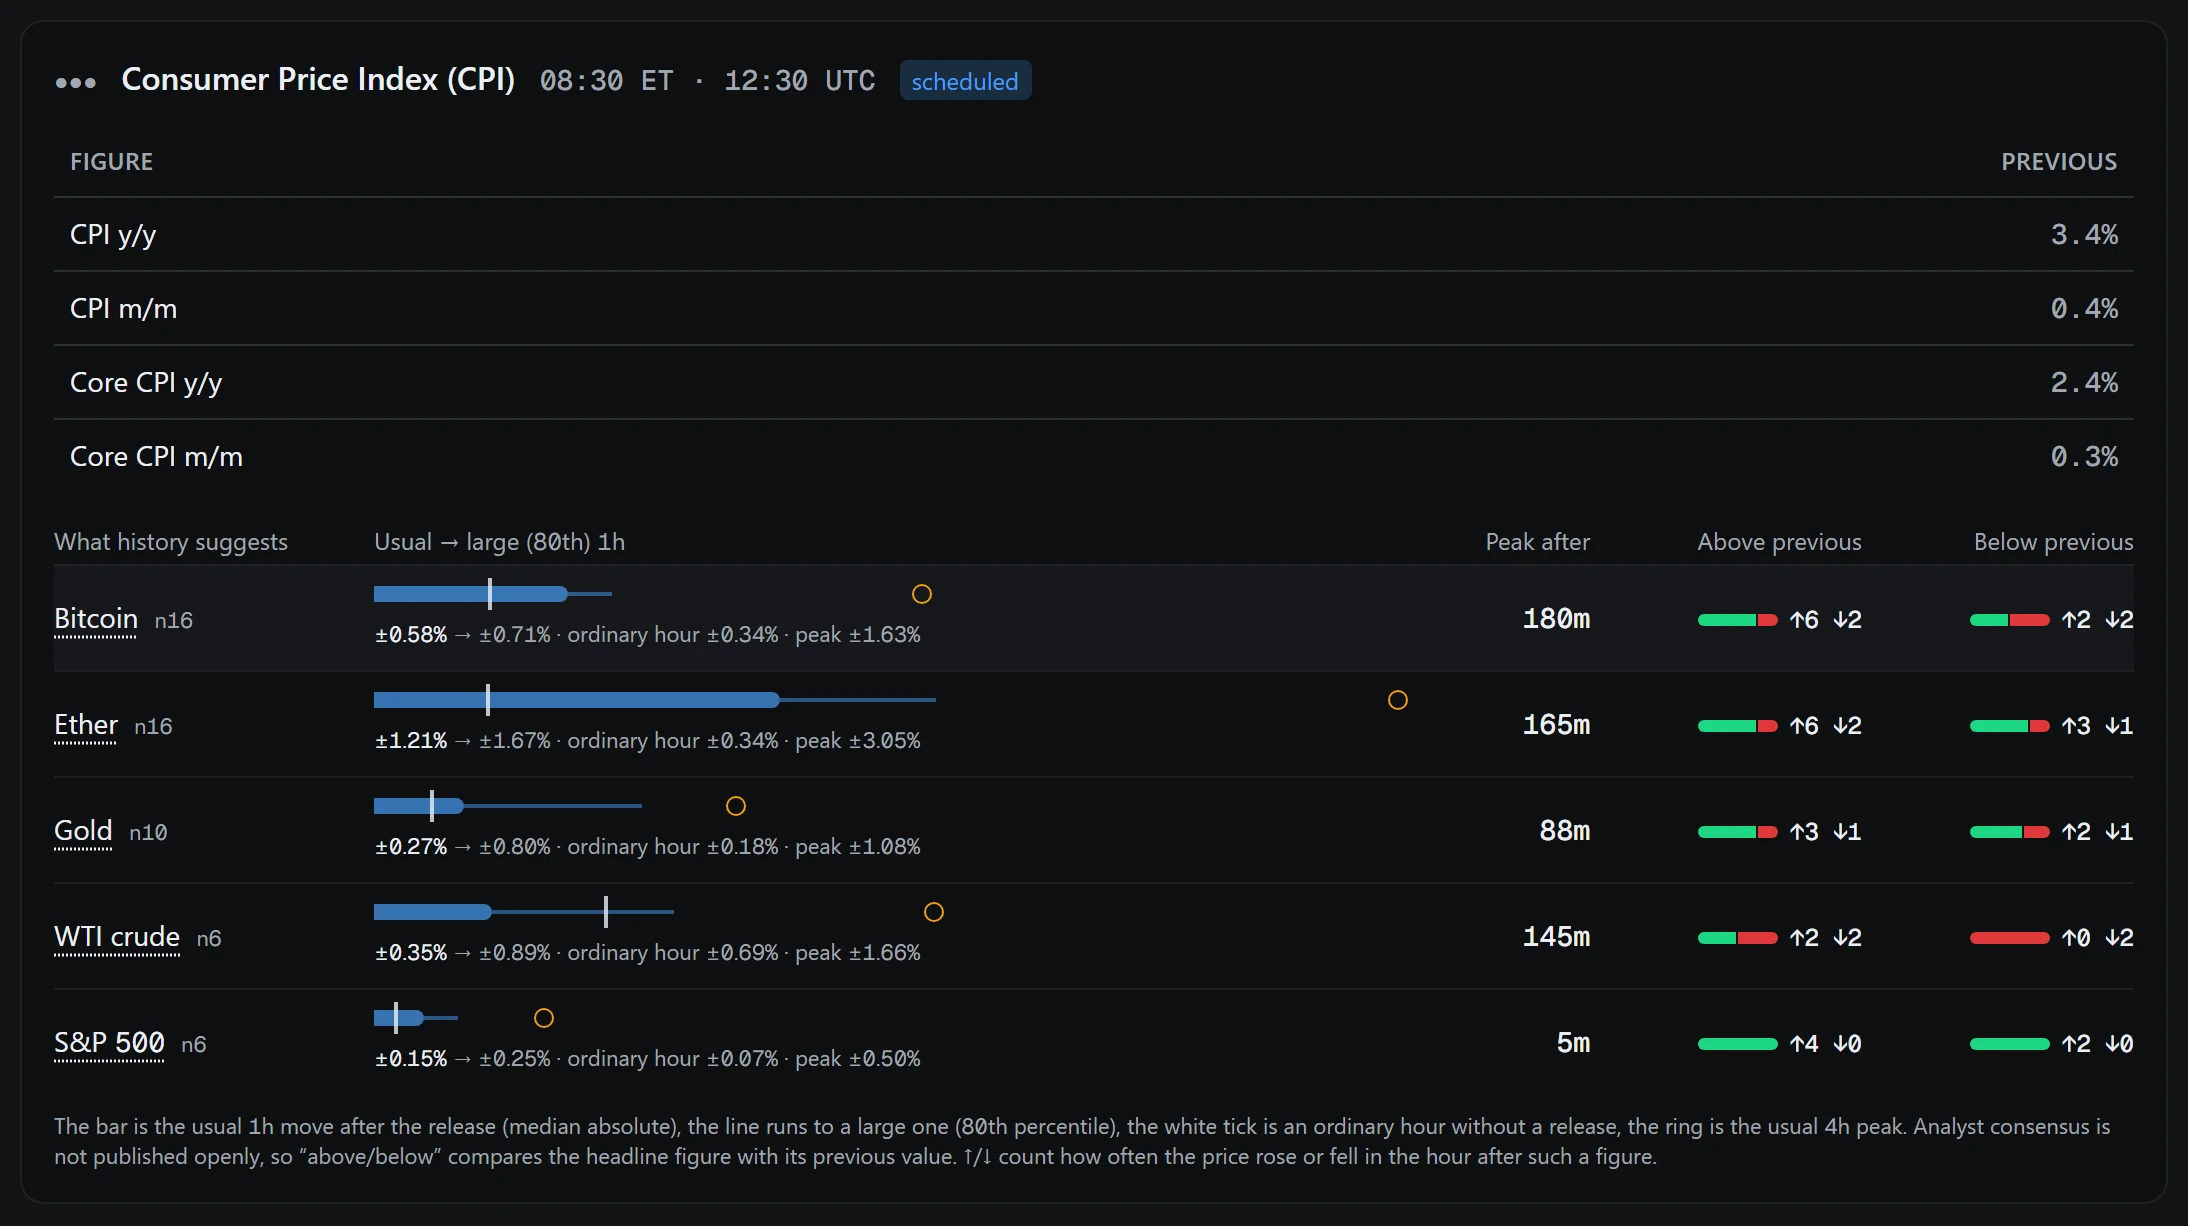
Analyst consensus is not published in open sources, so above and below are judged against the previous value of the indicator's headline figure. The arrows ↑ and ↓ count how often the price rose or fell in the hour after such a figure. The history covers a year and a half, roughly fifteen releases per monthly indicator, so the sample size always sits next to the estimate.
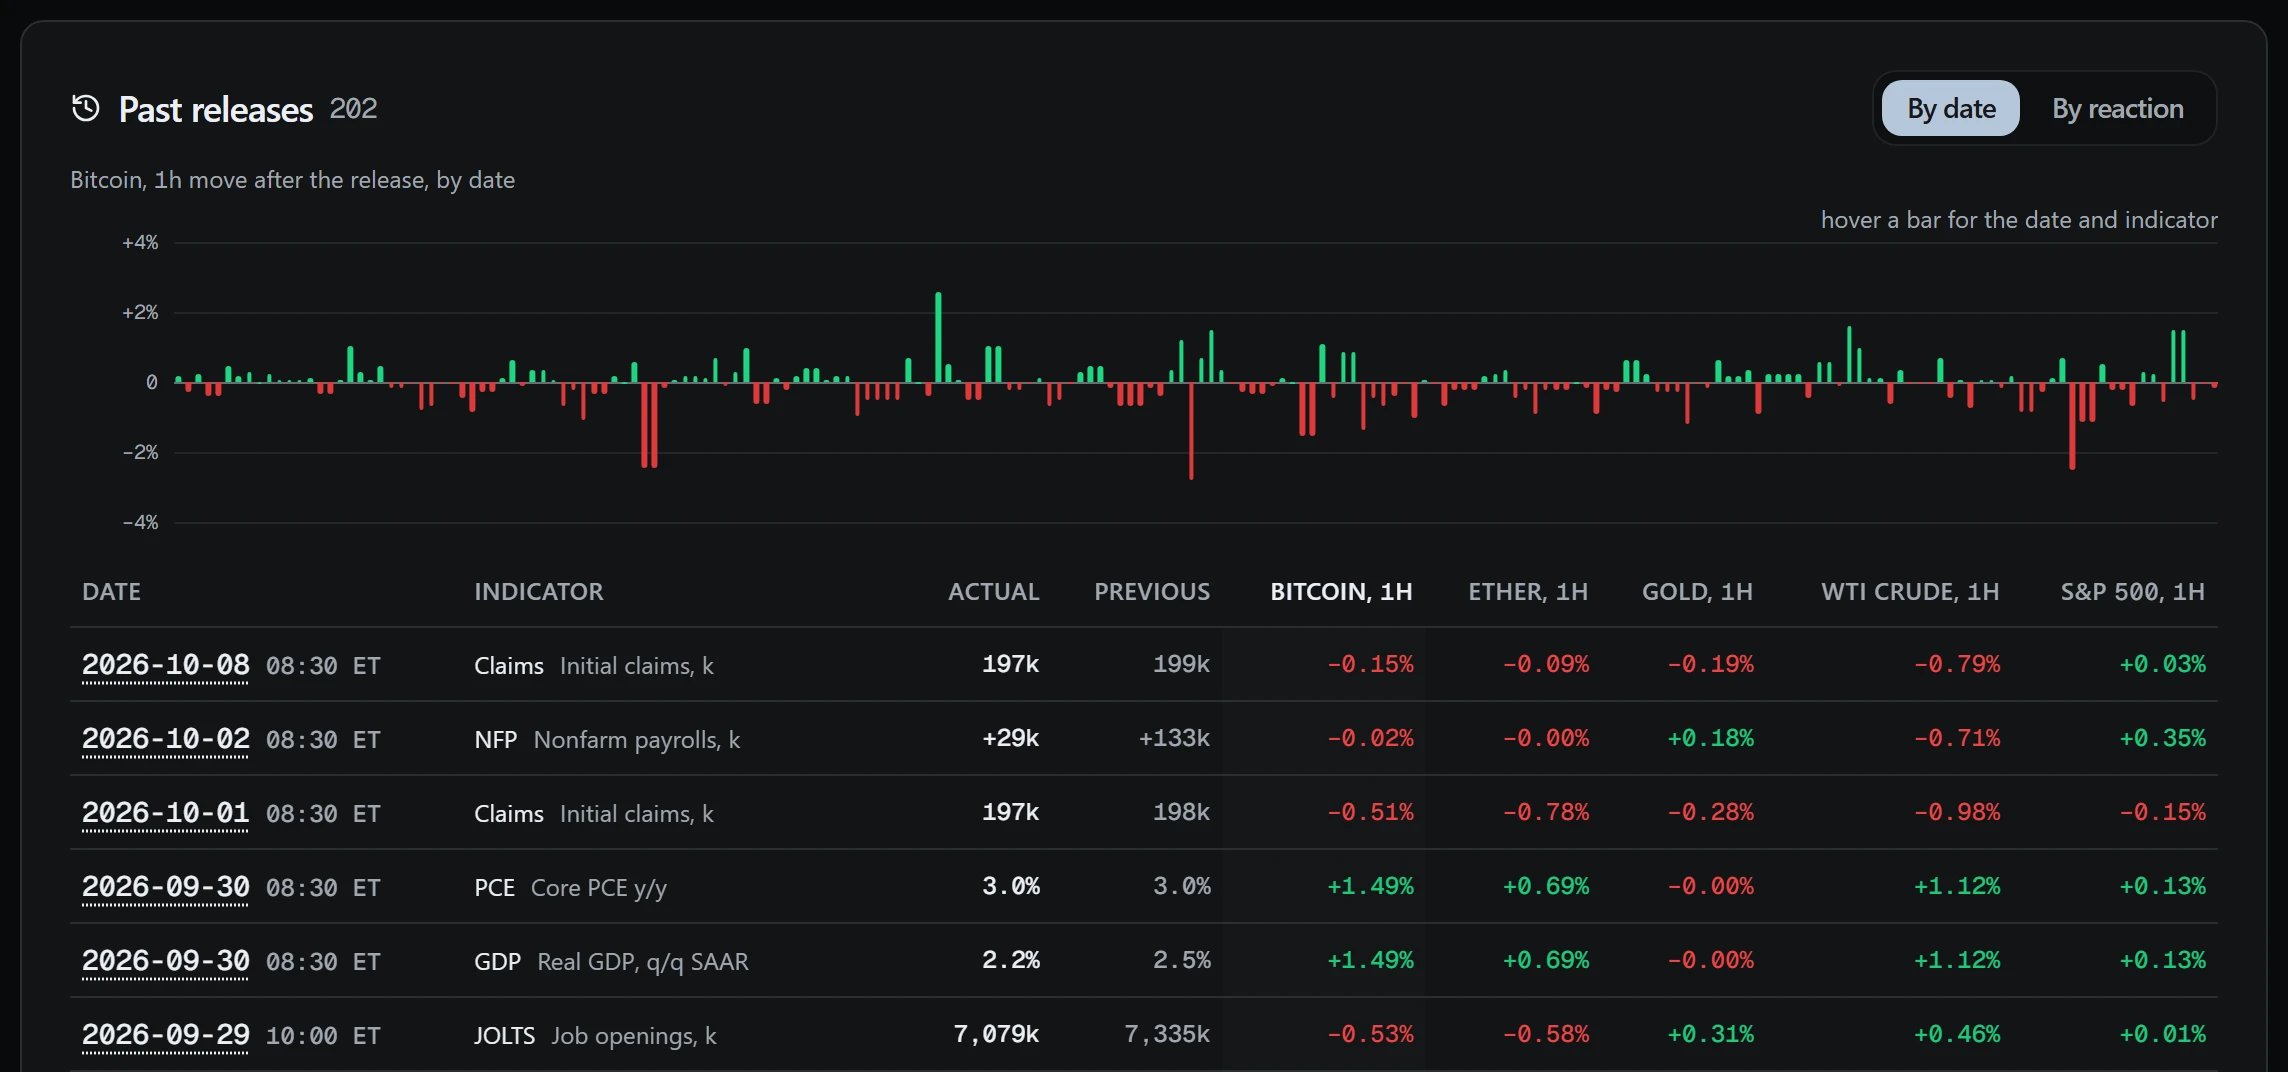
For a release that is out, the five instruments' reaction is shown as bars after 15 minutes, an hour, 4 hours and a day on one scale, over a band of the usual hourly move, so you can see straight away whether the reaction was stronger than normal. Above the list of past releases is the chosen instrument's one-hour move after each release, by date.
The calendar is rebuilt hourly: right after the trade export come the macro and earnings exports. If the snapshot is over three hours old, a warning appears above it. Until full access is opened, the section shows the three latest and three nearest releases, and statistics use only those.
Release time is shown in New York time and UTC, not in the browser's zone. The calendar forecasts nothing: it shows what followed past releases, and a past size of move does not promise the same later. Trading these markets carries a risk of losing money; this is not investment advice.