New section: Momentum & funding — the day's moves
Platform ·
The day's strongest liquid moves across every Binance perpetual, checked against open interest and against each coin's own funding norm.
The Market section has a new Momentum & funding tab: a screener over every Binance USDT perpetual, with crypto and TradFi on separate tabs. Coins with at least $10M of daily turnover (the bar can go down to $5M or up to $100M) are split into long and short candidates by their 24-hour move. Each one shows the change over a day and a week, volume, open interest and its change, how many times open interest turned over in a day, annualized funding and the distance to the yearly high.
The data comes from the public Binance USDⓈ-M API: price, volume and the current funding in two requests for the whole market once a minute, everything else per contract. Coins with turnover below $5M do not enter the screener at all, because on a thin market neither the move nor the funding means much. The tables show the twenty strongest moves up and down, and the Show all button opens the rest. Selection always follows the 24-hour move; a column header only reorders the selected coins.
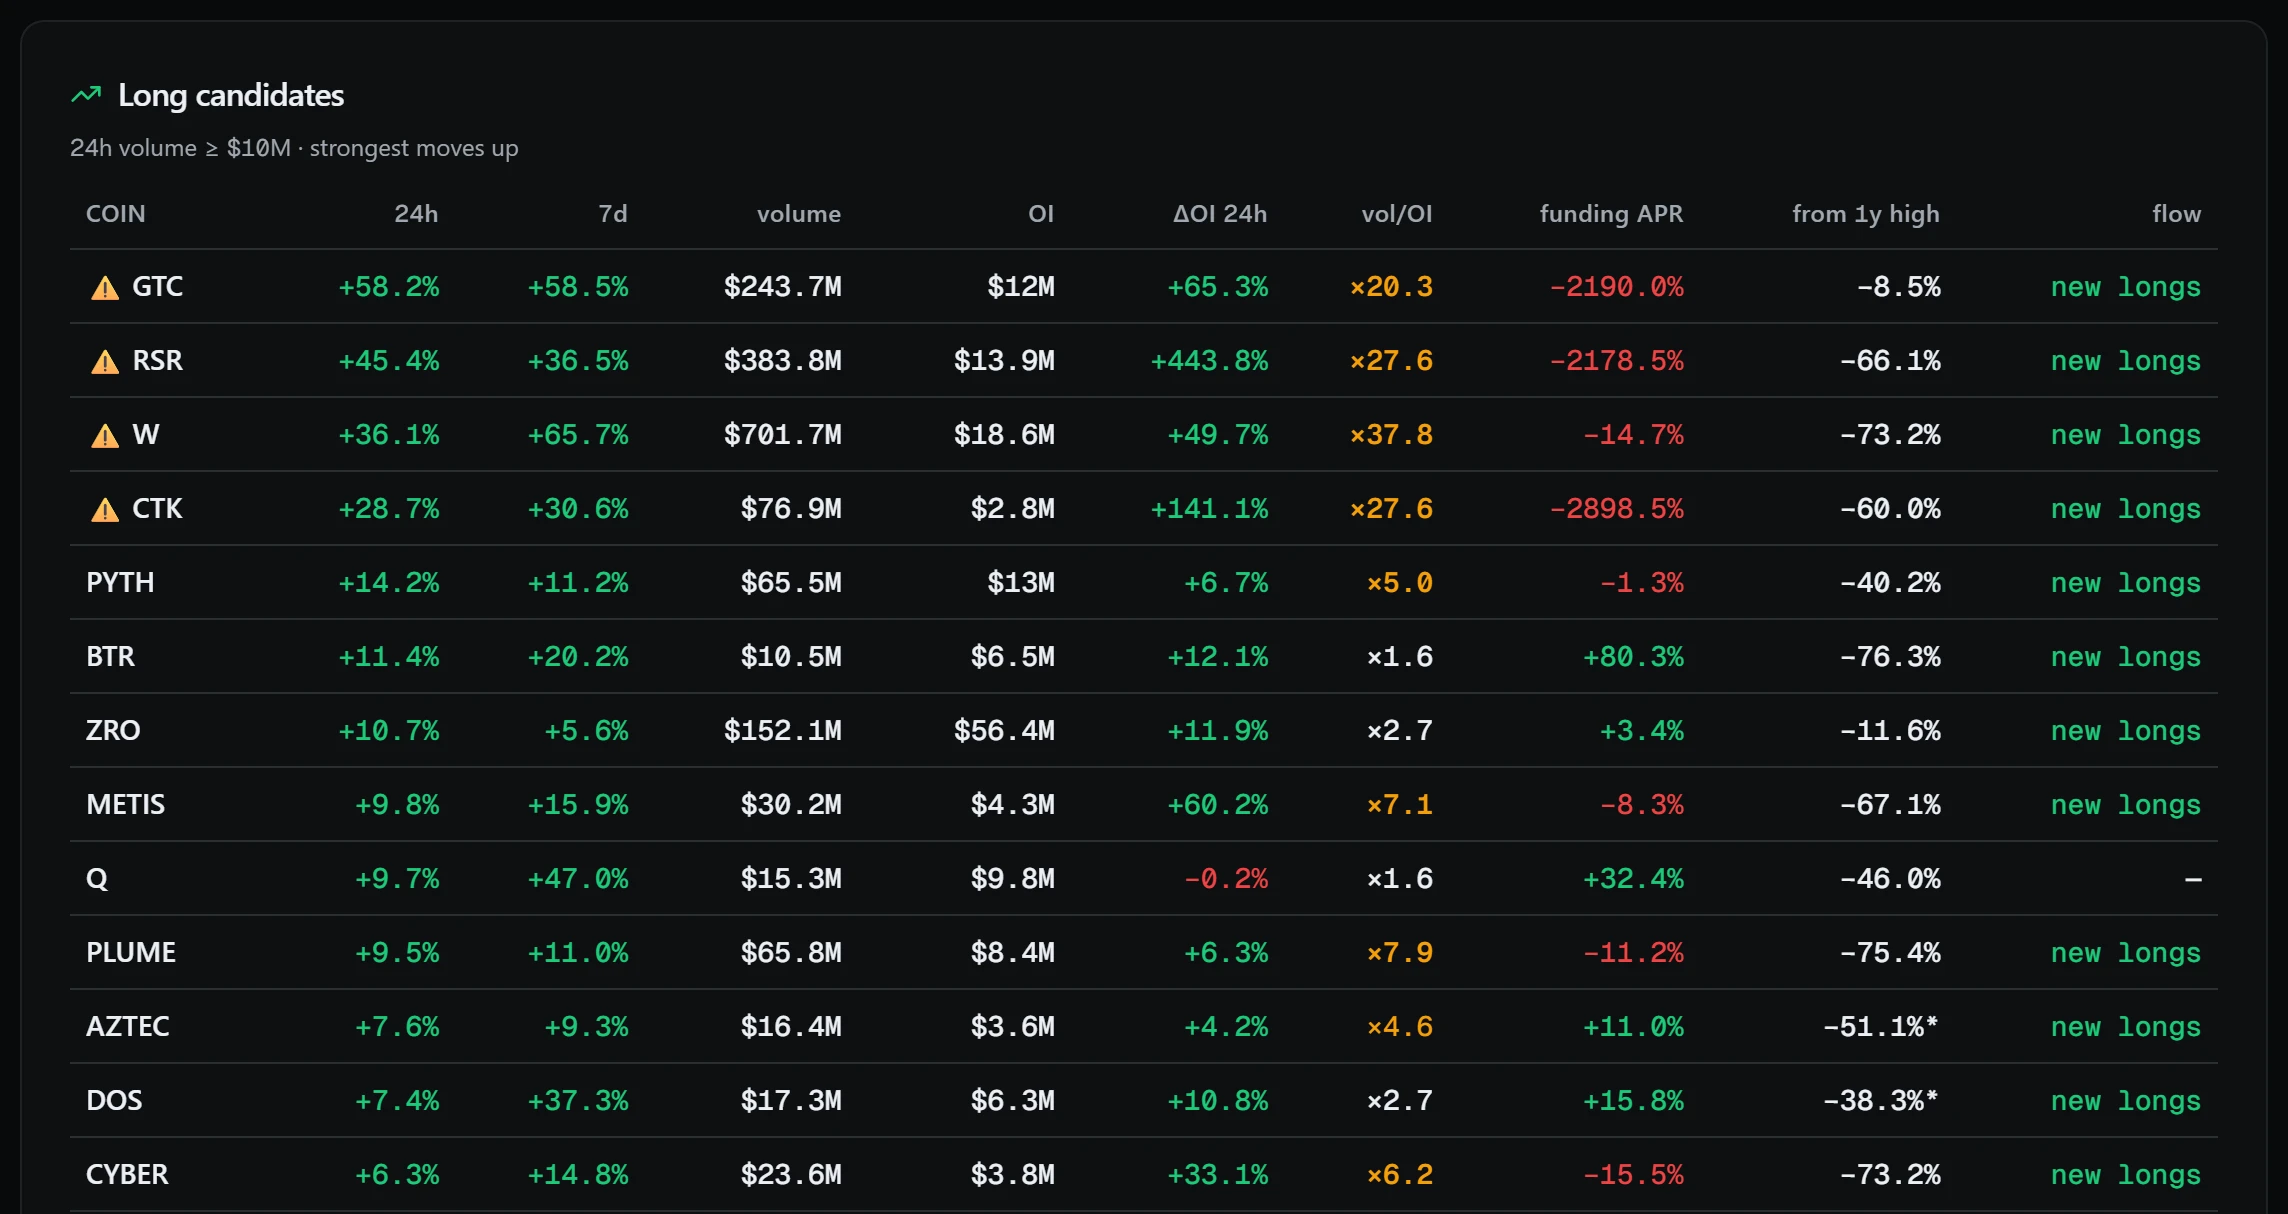
A price move on its own says little; what matters is who is behind it. The flow column pairs price with open interest: a rise with rising OI means new longs, a rise with falling OI means shorts closing, and the same on the way down. The flow map shows this for the whole market at once: each coin is a dot placed by its 24-hour price move and OI change, sized by volume, and a click opens the chart.
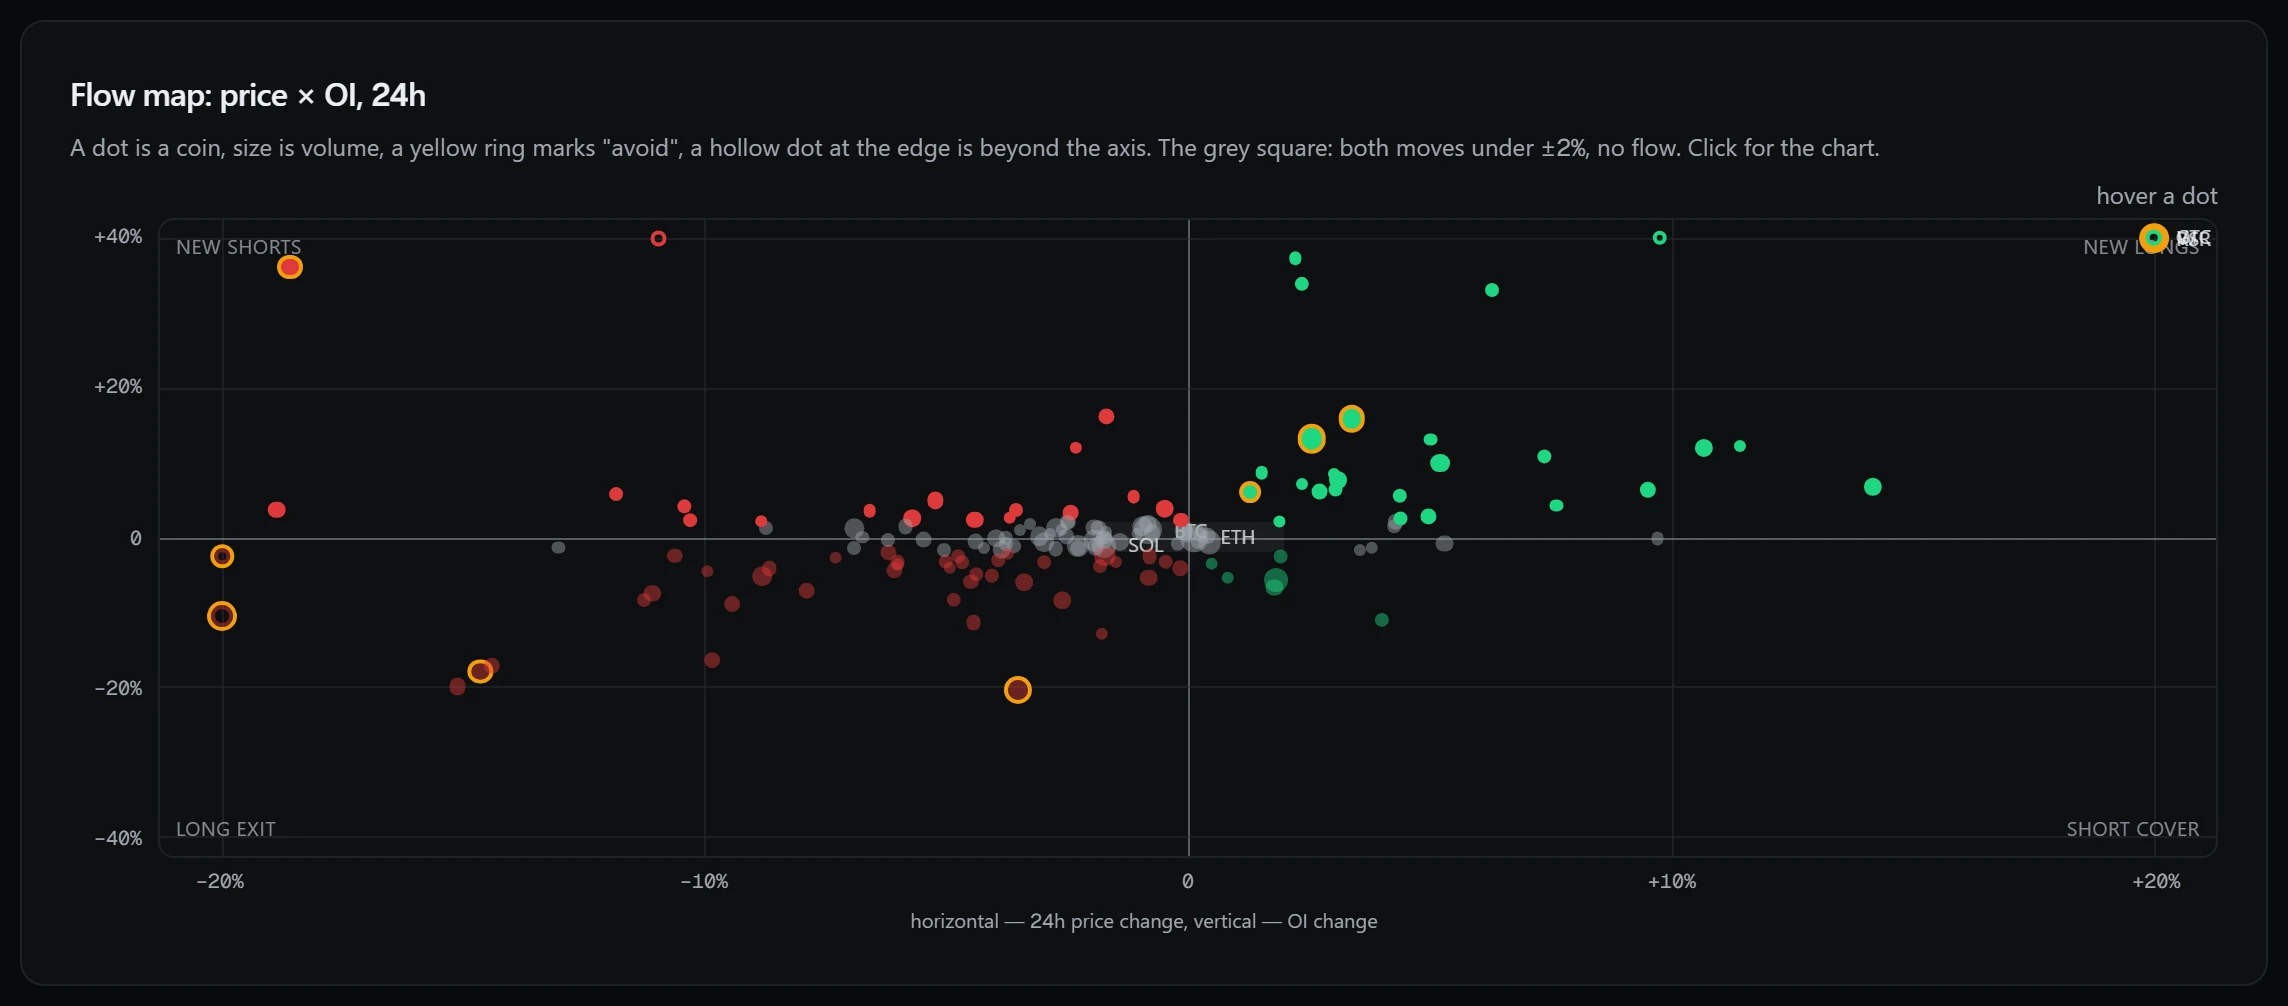
Flow is determined only if open interest has changed by 2% or more over the day; anything smaller is noise, and the column shows a dash. The vol/OI column shows how many times open interest turned over in a day: above 3 the move is hot, above 5 it is a frenzy. The grey square in the middle of the flow map is the zone where both changes are under 2% and there is no flow. Coins on the Avoid list are marked with ⚠.
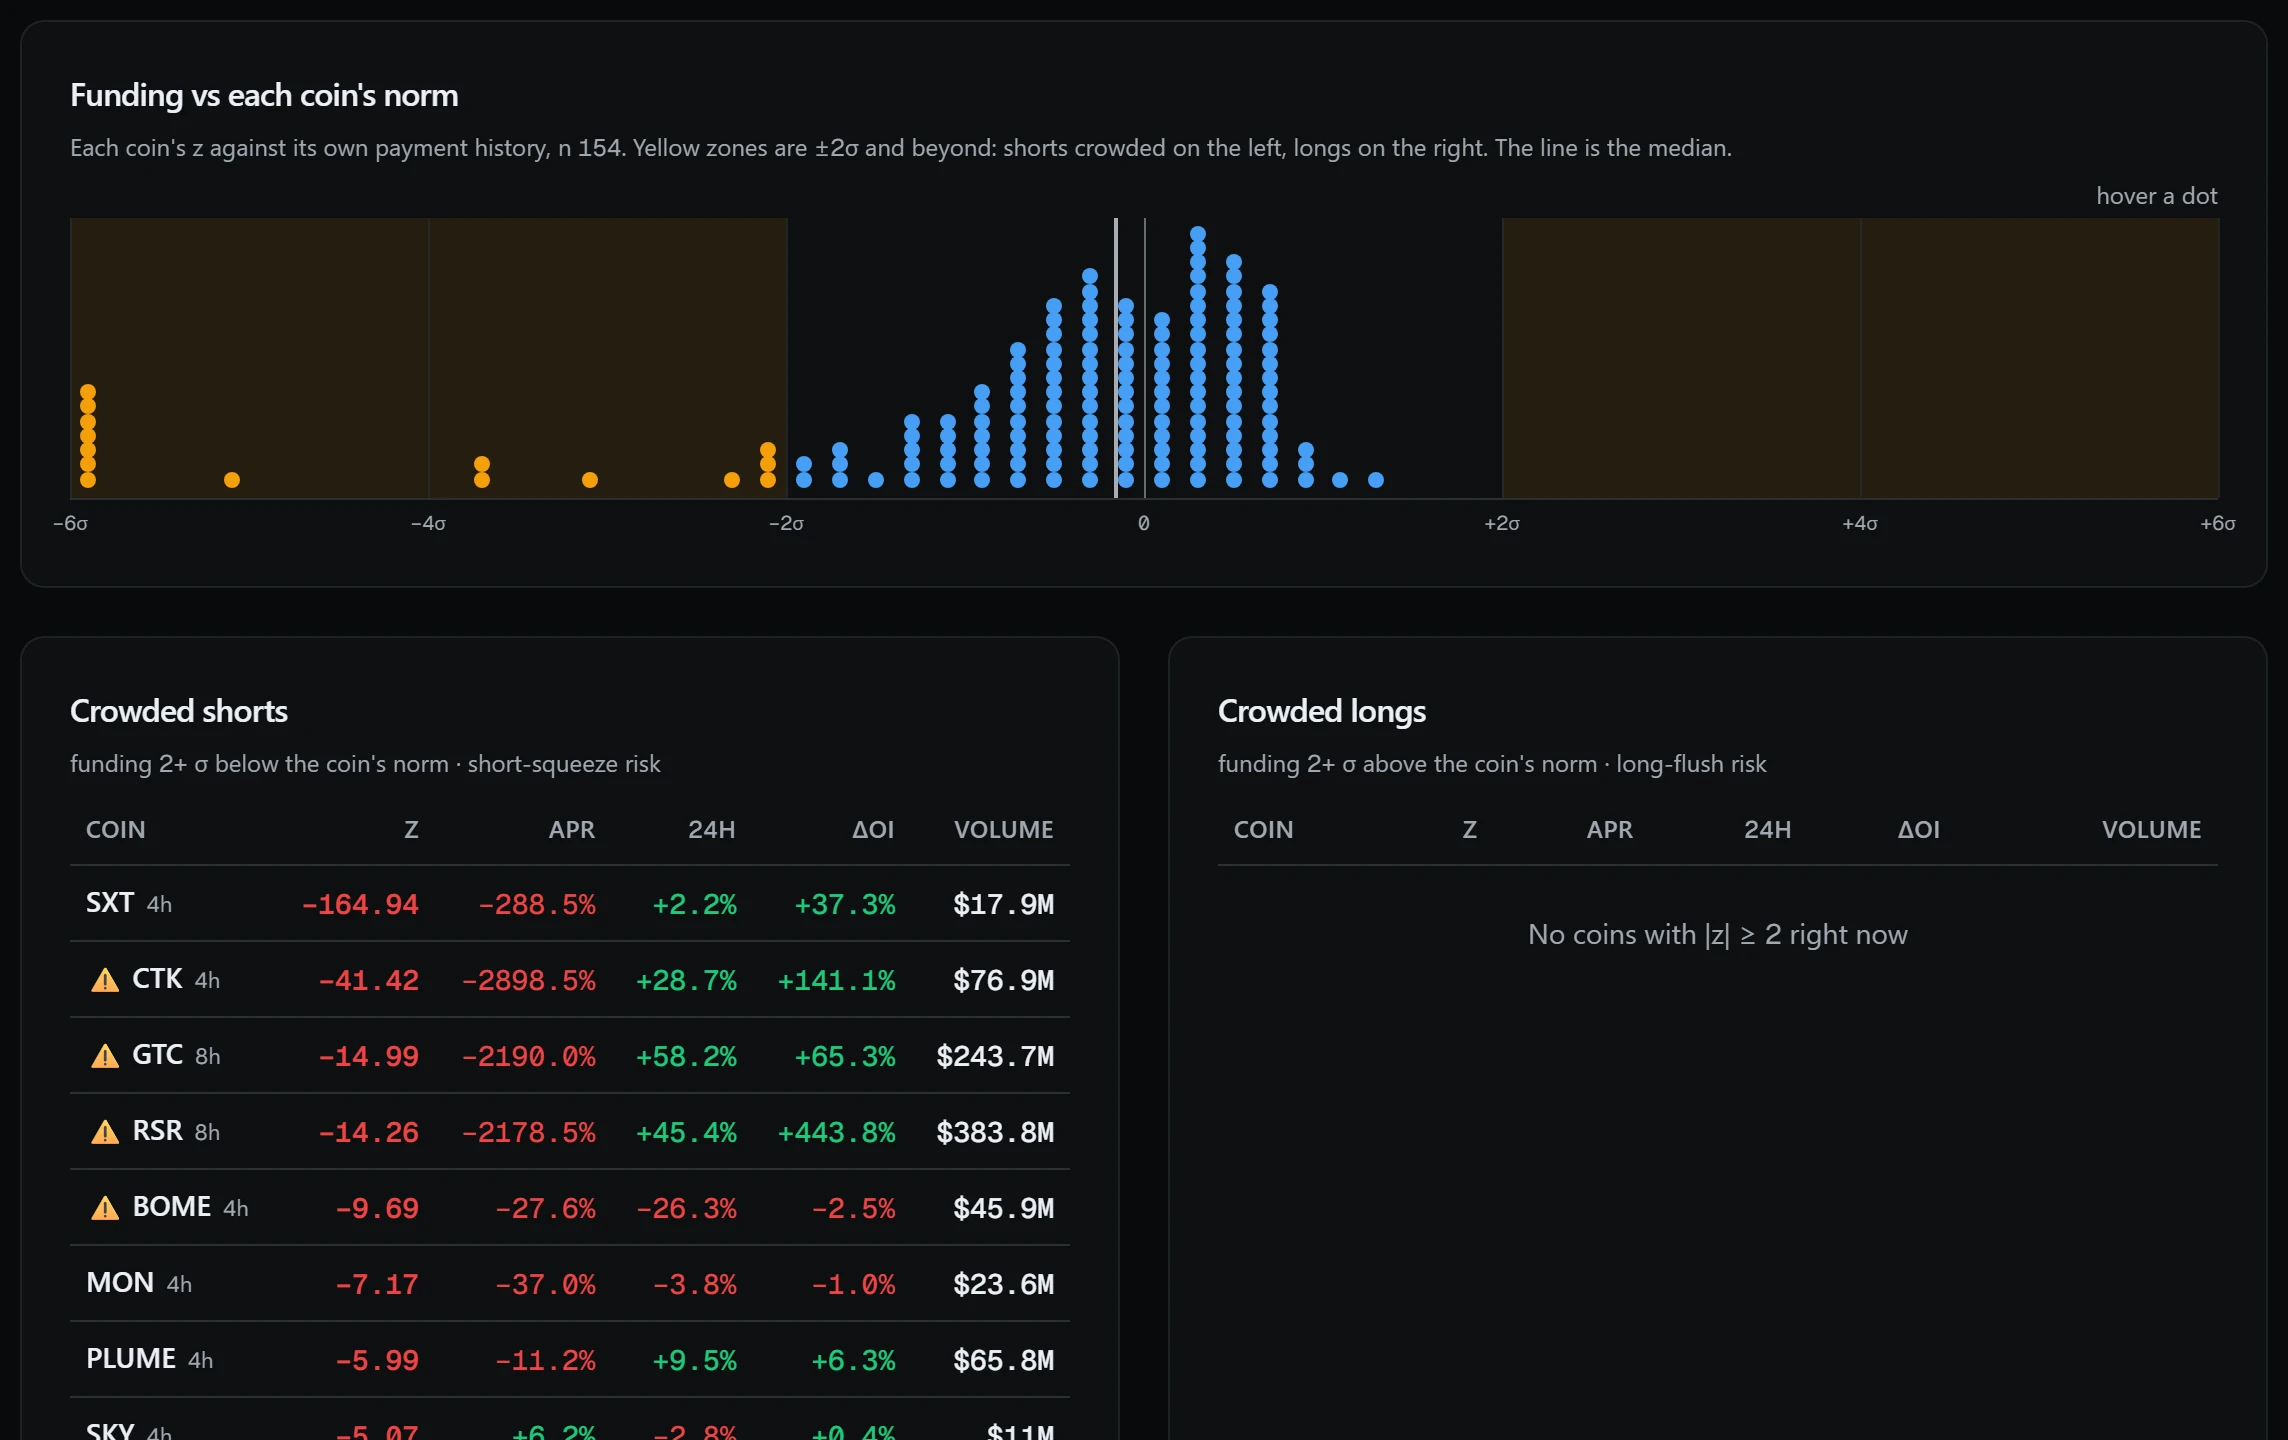
Funding is compared not with a fixed threshold but with the coin's own last 200 payments. If the rate has moved two standard deviations or more from its norm, the coin lands in Crowded longs or Crowded shorts: one side is packed in, and a sharp move against it, a squeeze or a flush, becomes more likely. While the tab is open the data is recalculated once a minute; the slow series, yearly candles and funding history, fill in over the first few minutes.
A coin's norm is its latest funding payments, at least 30 of them: with less history the z-score is not calculated. The rate is annualized by the contract's real interval, which is 1, 4 or 8 hours. The z value signals crowding, not the direction of the price. The distance to the yearly high is taken from daily candles; an asterisk means the contract is younger than a year and the high is counted from its listing.
Data of different speeds refreshes differently: open interest every 15 minutes, funding history every 2 hours and daily candles every 6 hours. While the series fill in, the top of the page shows how many symbols are ready, and the page asks the site more often. The screener lists liquid Binance contracts and is not investment advice; leveraged trading involves the risk of losing money. Without activation the section appears in preview mode, with three rows per list.