Strategies: every champion on one axis
Platform ·
The 13 strategies can now be compared at a glance — by the lower bound adjusted for the number of variants tested, by drawdown and by checks on slices of history.
The Strategies section has a new Champions side by side block above the cards: all 13 strategies on one axis, ordered by the lower bound of the result adjusted for the number of variants tested. The filled dot is that bound, the bar runs from it to the result over the whole history, and the tick is the bound without the adjustment. The shorter the bar, the less the result depends on a lucky fit.
The Strategies section sits in the Research group of the dashboard. It collects the champions of our strategy search, one per ticker: the configuration the search judged best and its statistics over the whole history since 2023. The strategies trade only the long side and exit only in profit. The calculation uses a notional deposit without compounding. Tickers are grouped as Crypto, TradFi and Resources.
Champions are judged not by the result itself but by the lower bound of the result adjusted for the number of variants tested. The more configurations are tried, the likelier the best one won by chance, and the adjustment accounts for that. The order in Champions side by side follows this bound. If a champion has a reason for being invalid, its card shows a disqualified mark, next to the search round number and the date it became champion.
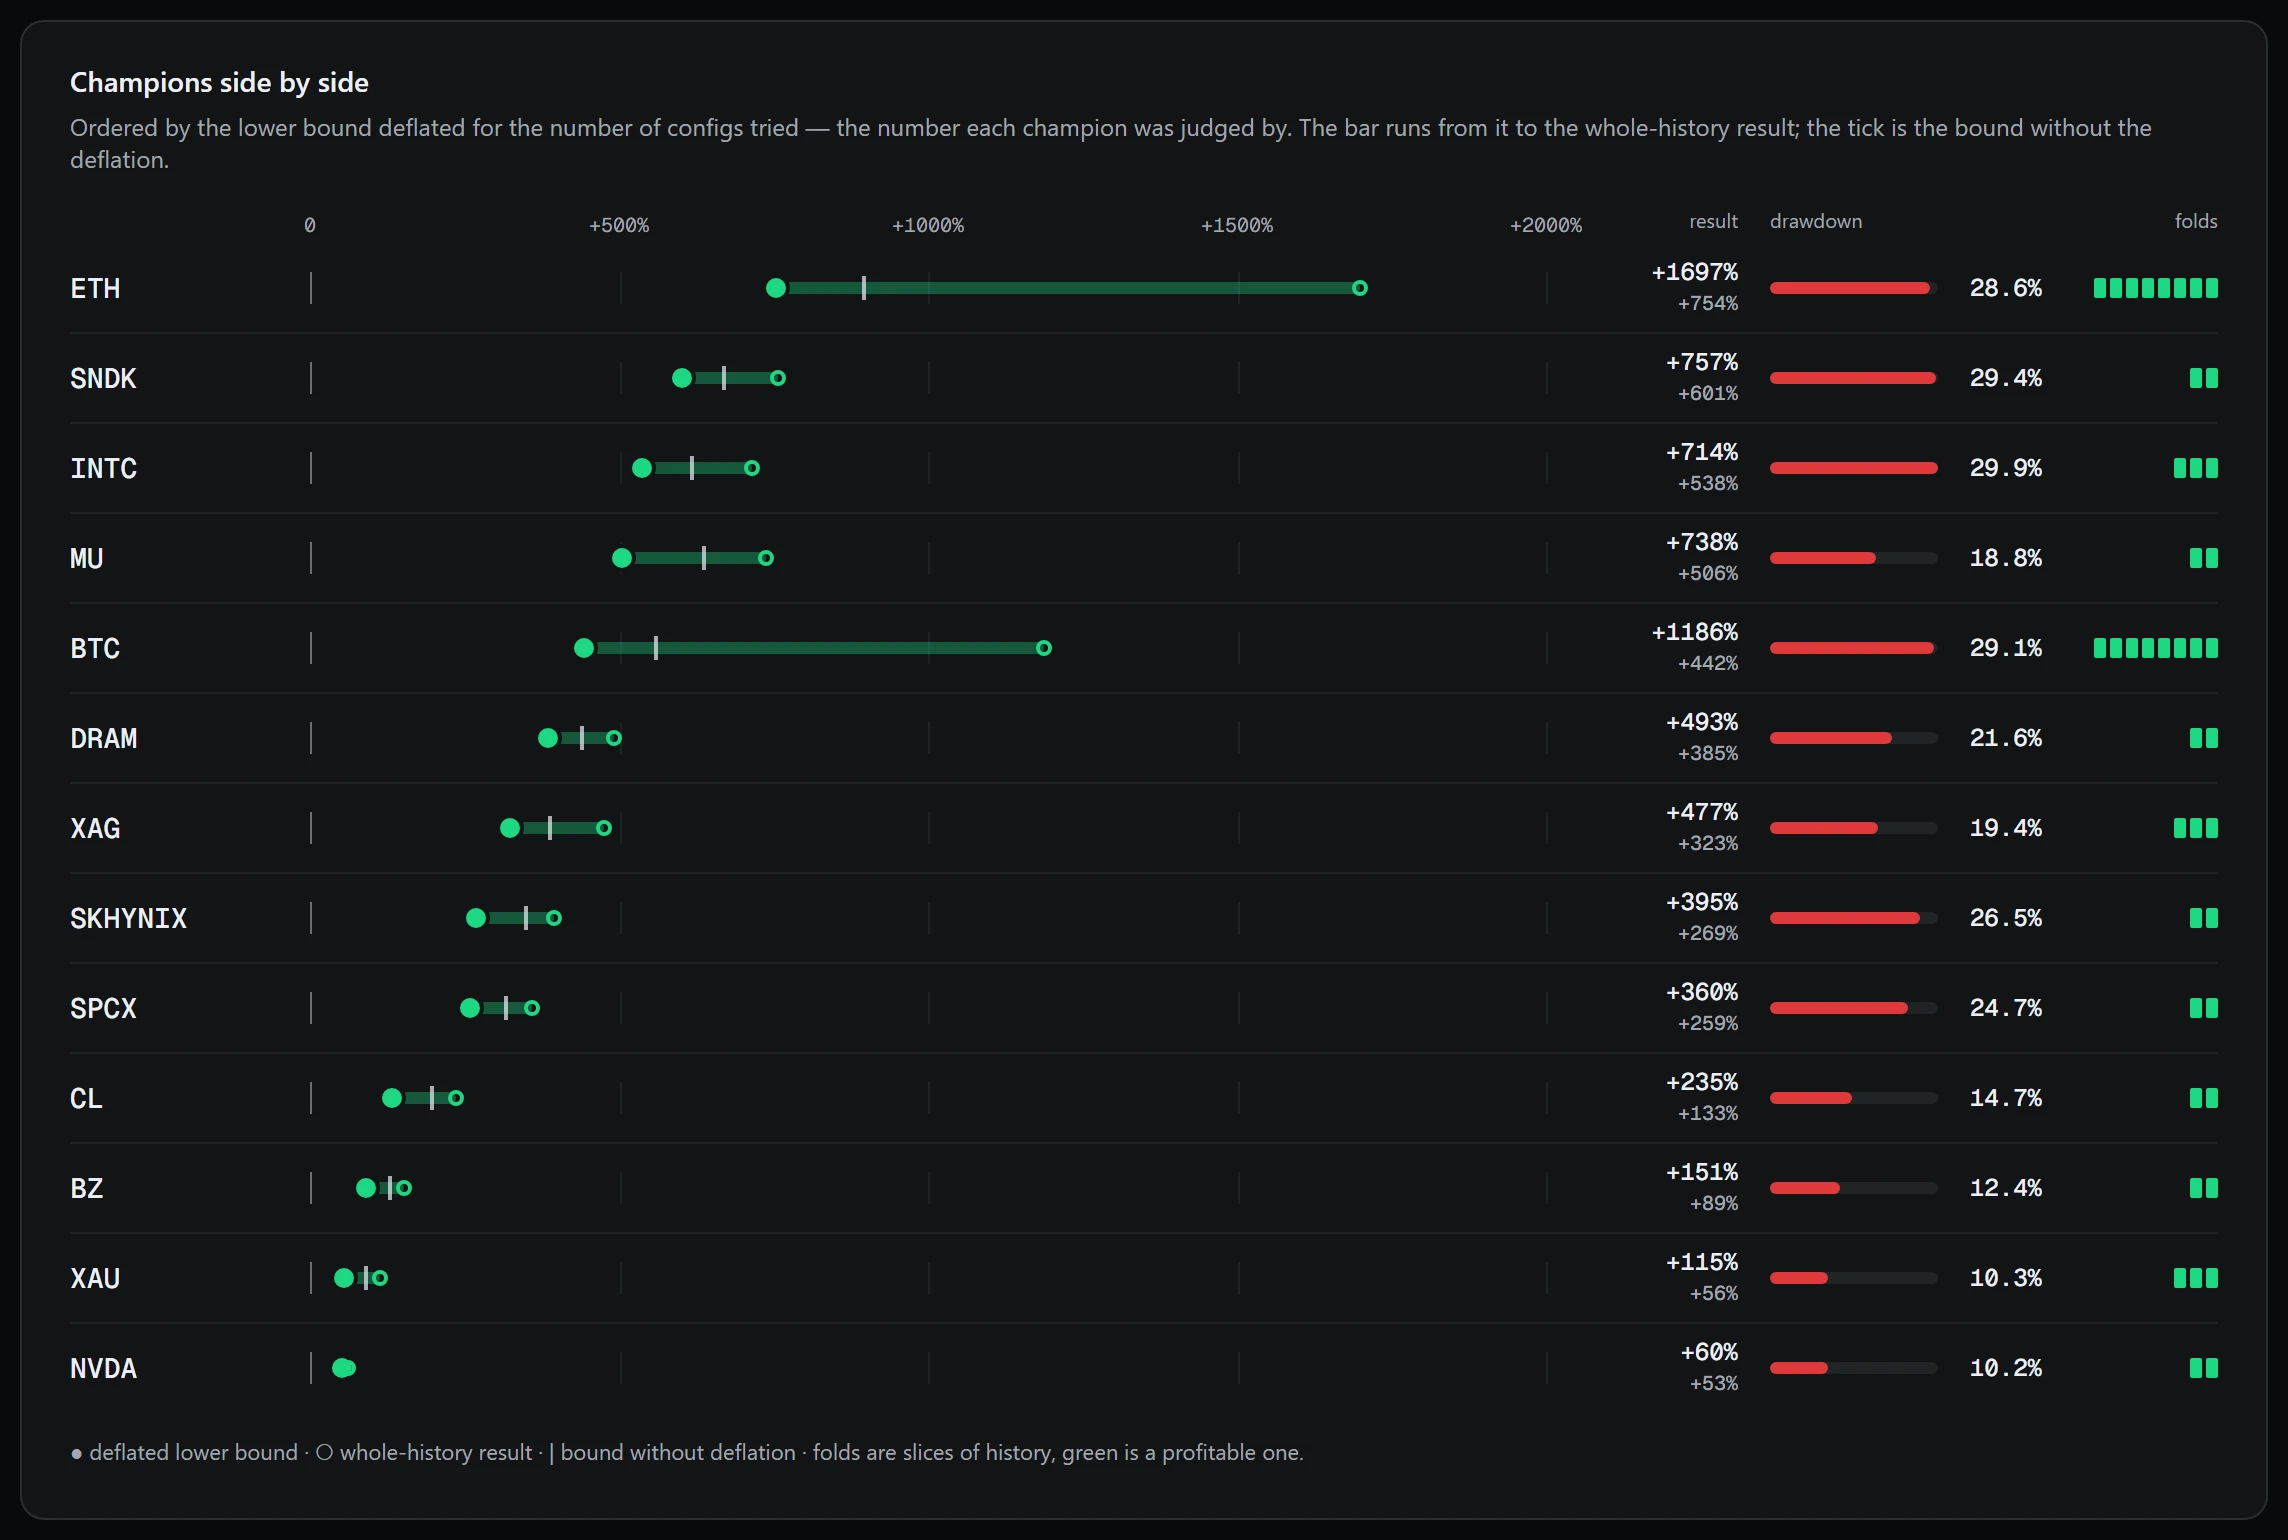
On the right are the maximum drawdown and the folds. History is split into slices and the strategy is checked on each one separately; a green mark is a slice in profit. A strategy that makes money on every slice is sturdier than one whose result came from a single good year. Folds in profit now also appear on every strategy card: they were calculated before but never shown.
In Champions side by side, the same adjusted lower bound is printed in small type under the whole-history result, and the drawdowns of all champions are drawn on one scale so rows can be compared by eye. Folds appear as marks: green for slices in profit, red for slices at a loss.
A champion card shows the number of trades, maximum drawdown, the out-of-sample result with its trade count, folds in profit, average number of averaging steps, maximum hold and headroom to liquidation. The coloured strip shows the shares of exit types: take-profit steps, trailing stop, swap, reversal and deadline. Because exits happen only in profit and there is no stop order, a position can stay at a loss for a long time; drawdown, hold and liquidation headroom show it, and it carries a risk of losing money.
Each strategy can be checked on a chart: the Download TradingView script button gives a Pine v6 script with the champion's parameters as defaults. It is added to a BINANCE:ticker.P chart on one of the champion's timeframes. Funding and slippage are not modelled in the backtest, and liquidation is shown in the panel but never executed, so the script reproduces the rules, not a real account.
The data arrives as a snapshot, not a live request: cards and scripts stay available even when the search itself is off, and figures do not change silently between two updates. The snapshot date is given in the section description. Until full access is opened, the section shows three cards and the configuration parameters are hidden.
The strategies' figures have been refreshed on recent history. It is still a backtest that leaves out funding and slippage: it shows how the rules worked in the past and does not guarantee future results.