New section: Strategies — statistics since 2023
Platform ·
The best strategies from our search, one per instrument: statistics over history since 2023 and a script to check them in TradingView.
The dashboard now has a Strategies section. It gathers the best strategies our search has found, one per instrument. There are 13 so far: bitcoin and ether, stocks (NVIDIA, Intel, Micron, SanDisk, SK Hynix and others), gold, silver and oil.
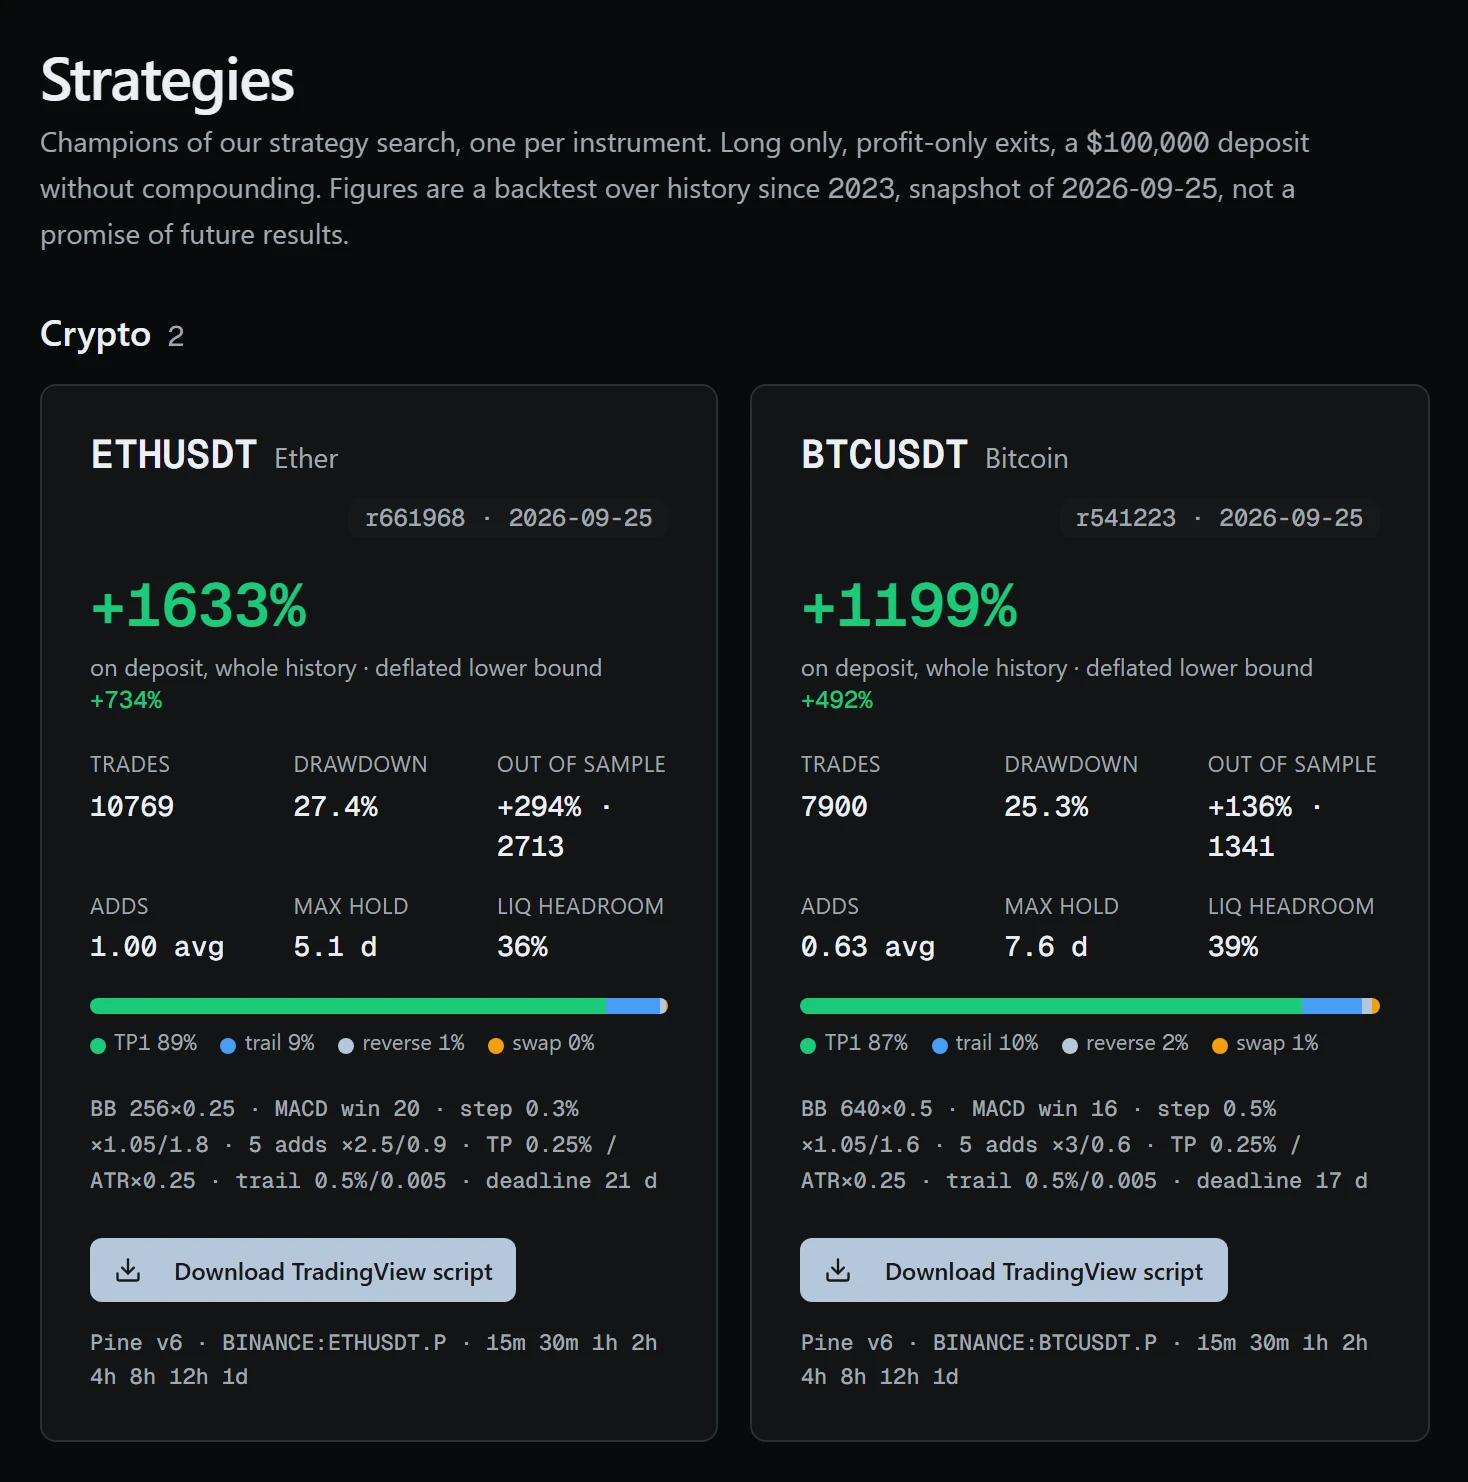
The strategies in the section are champions of a search. For each instrument many configurations are tried, and the best by the lower bound of the result, adjusted for the number of variants tested, goes onto the card. The result is calculated on a notional $100,000 deposit without compounding. The data arrive as a snapshot, not a live query, with its date in the section header, so figures do not shift while the search crowns a new champion. Each card shows the round and selection date.
Each card shows the result on deposit over history since 2023, the maximum drawdown, the number of trades, the headroom to liquidation and how trades were closed. Next to the total sits a lower bound adjusted for the number of variants tested, and a separate figure gives the out-of-sample result, on data the strategy was not fitted to. Those two numbers show whether the result holds up or is just a lucky fit to history.
Above the cards there is a summary called Champions side by side. For each ticker the bar runs from the adjusted lower bound to the whole-history result, a tick marks the bound without the adjustment, and drawdown and folds are shown on the right. Folds are slices of history, and a green slice ended in profit. A wide bar means that the result rests on luck more than on rules.
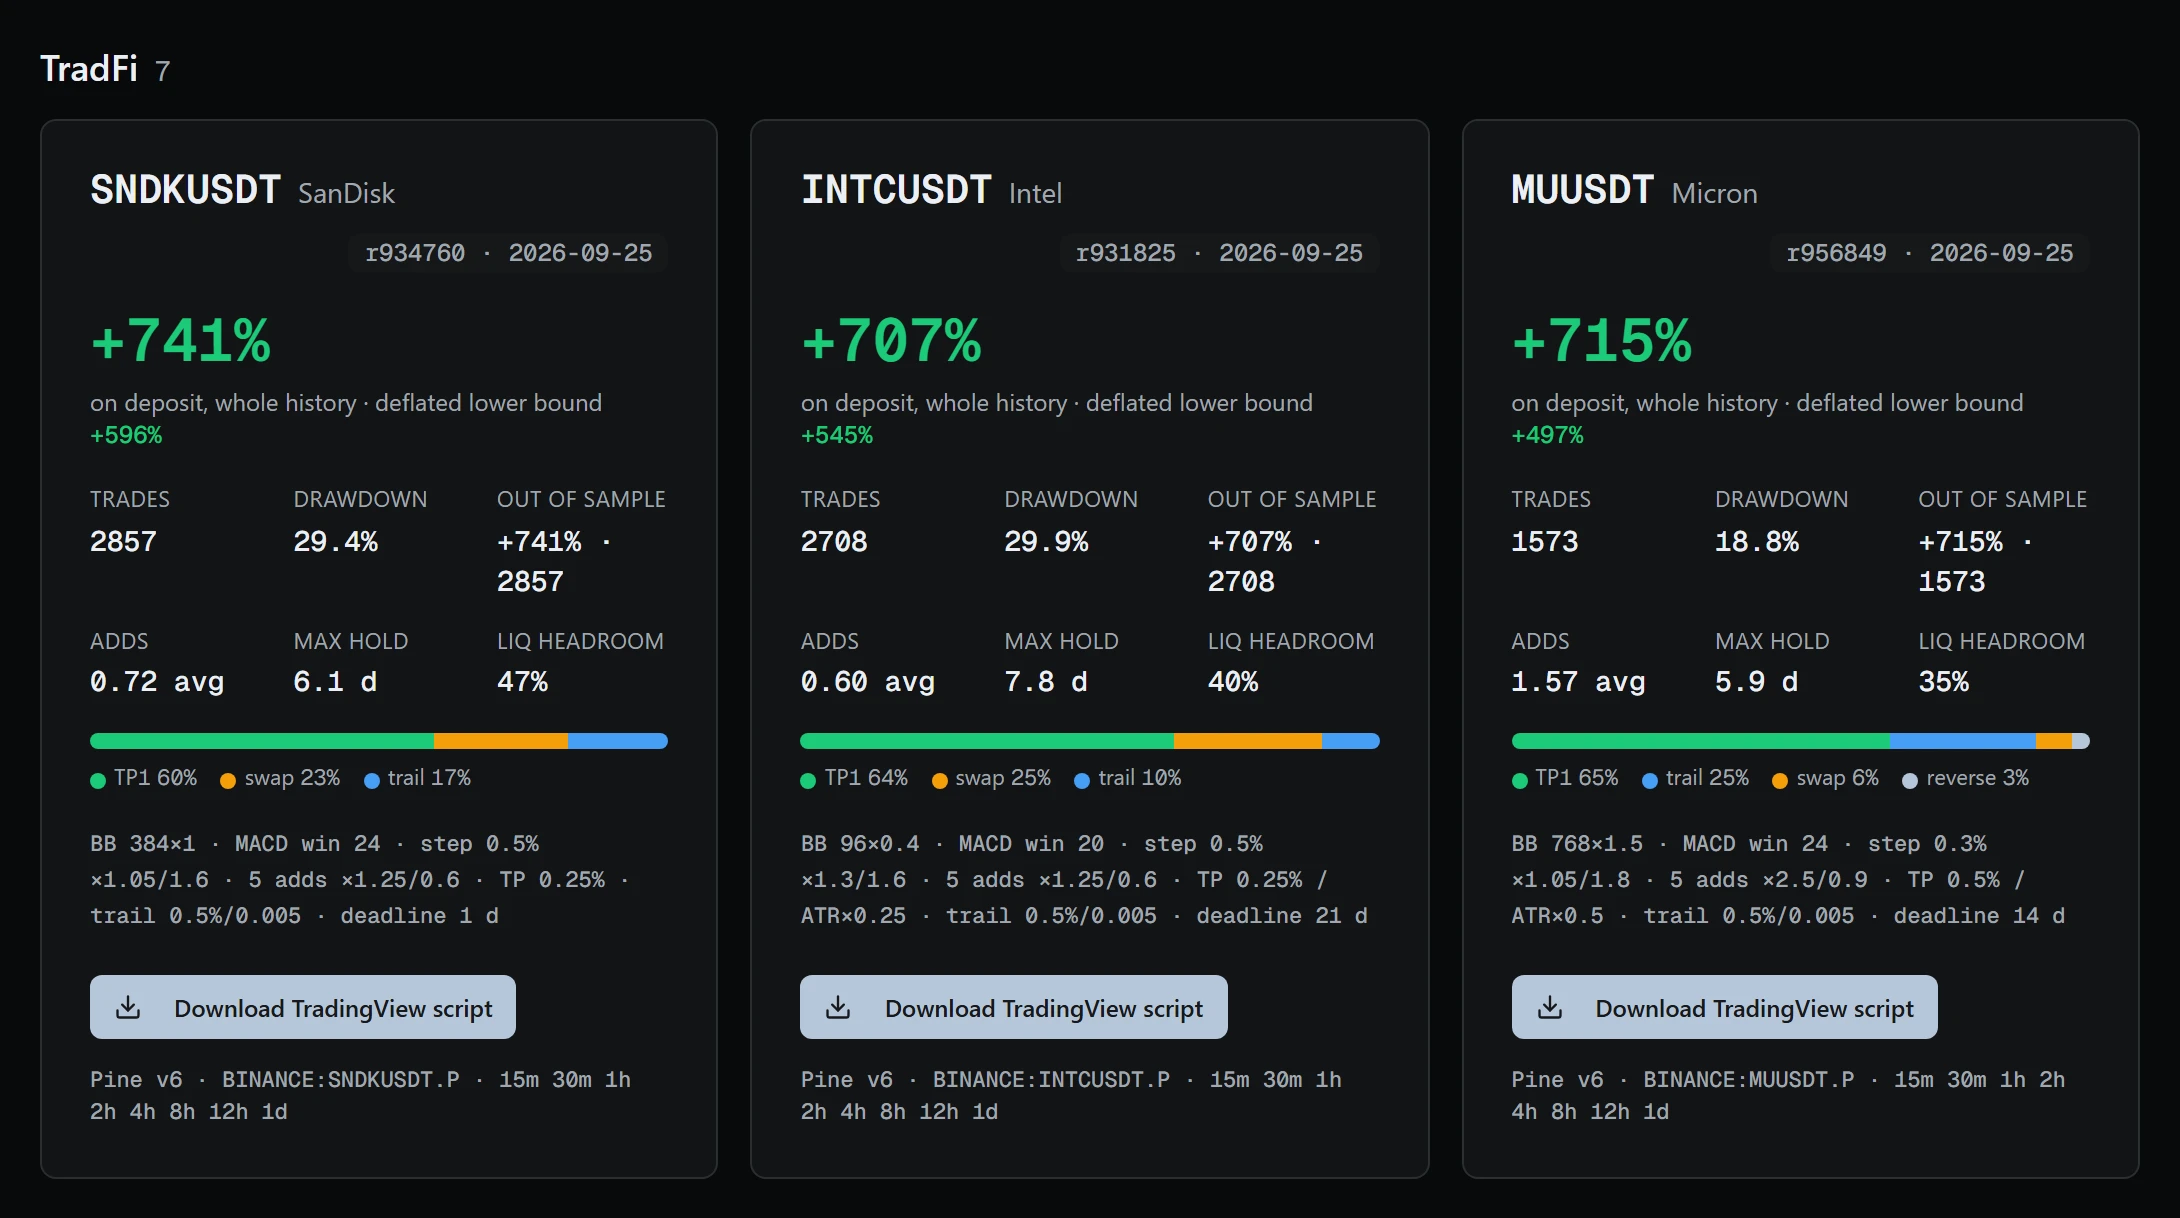
All strategies share one design and differ only in numbers. Entry needs three conditions together: an MACD turn in a set window, a break of the BB band (relaxed when ATR is high) and the price stretched from the daily EMA. After entry the position is averaged on a ladder with a set step and number of adds. Exits are profit-only: take-profit rungs, a trail from the peak, a deadline exit, a reverse zone and a signal swap. No exit is meant to lock in a loss.
Every strategy trades long only and without a stop-loss: the position is averaged down, and the rules only exit in profit, so the main risks are drawdown and distance to liquidation, and both figures are on every card. You can check any strategy yourself: the Download TradingView script button exports its rules as a Pine script, and the backtest replays on the Binance chart. The figures are a backtest that leaves out funding and slippage, and they do not guarantee future results.
The backtest in the script remains an approximation. It counts commission but not funding payments or slippage: 2 basis points of slippage on market fills is only partly covered by the profit-only exit buffer. A funding limit at entry, where a strategy has one, does not work in Pine, which has no funding data. Liquidation is shown in the panel and never executed. The script runs on the timeframe of the open chart, so pick one the strategy was measured on.
Without full access the section shows three cards without parameters; the full list and the parameters open with full access. Strategies sit in three groups: Crypto, TradFi and Resources. The section is research on past data: it does not show the manager's trades and is not investment advice. A backtest does not guarantee future results, and trading with leverage and no stop-loss carries a risk of losing money.