Trades and account reports, now as charts
Platform ·
Trade results by period as columns, every trade as a dot, the price path in a trade review as a bar; account history as candles and balance changes as a waterfall.
On the All trades tab, tables have given way to charts. By period shows a column for each day, week or month with the average result as a percentage of margin, and beneath it the number of trades and a small bar of wins and losses. A new block, Every trade, % of margin, plots the closed trades of the period as a dot with the median, so you can see whether the result rests on many trades or on a single lucky one. The table by period is still there, folded under the chart.
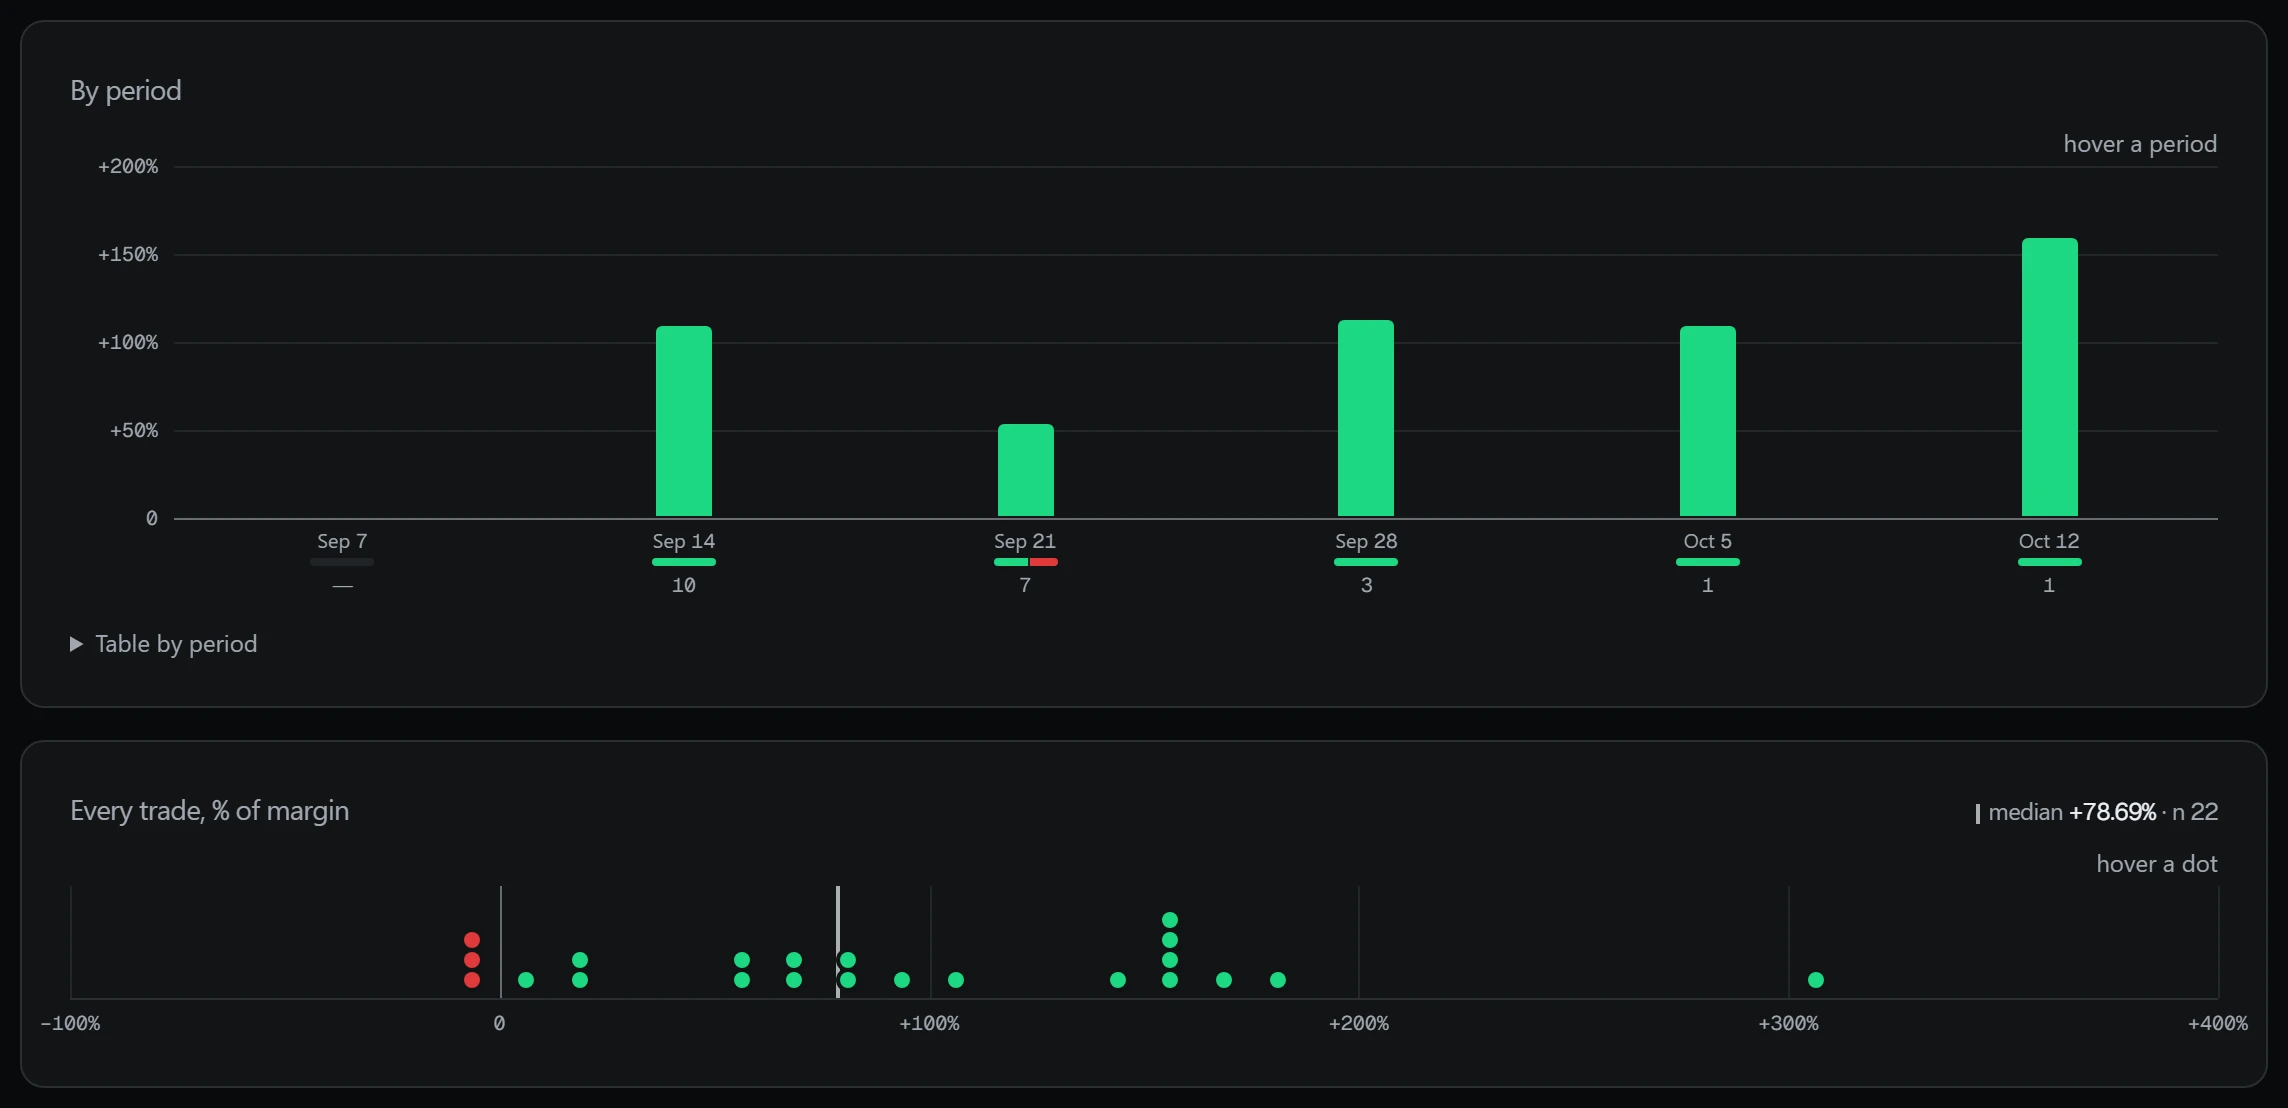
The window is chosen with the Week, Month, Quarter, Half-year and Year buttons: rolling 7, 30, 90, 180 and 365 days by close date, with open positions excluded. Tiles above the charts show closed trades, win rate (without breakeven trades), average result per trade, profit factor, average winning and losing trade, and the best and worst.
A trade's result is a percentage of the margin of a leveraged position, not of a client's account. Leverage multiplies the price move, and losses are counted the same way, so these percentages cannot be added into an account return; the tiles show per-trade averages. The platform shows the trades it includes in the section and does not claim they are the whole trading history. Past results do not guarantee future ones; leveraged trading carries a risk of losing money. This is not investment advice.
The By instrument block gathers results by ticker; below it stays the table of trades with column sorting and a ticker search. The window and sorting are kept in the page address. The number of trades sits next to the median: on a small sample the median says little.
In a trade review the price path is drawn as a bar: to the left the worst drawdown during the trade (MAE), to the right the best move (MFE), with a mark where the trade was closed. The Before entry scale shows where in the recent range the entry price sat.
A trade review is arithmetic on Binance candles, without AI: MAE and MFE as a percentage of the average entry price and, when leverage is known, of margin; the share of the best move the exit captured; time under water; and the price move before entry and after exit. The AI review opens separately and is written from the same figures.
On the overview, Account balance history is now drawn in candles, like a price chart: a candle is a day in your profile's time zone, or a week for history longer than six months, and a deposit and withdrawal on the same day show up as a wick. Balance change this month and the statement breakdown are now a waterfall from the opening balance, with each movement shifting the balance by its own bar. In Terms & accruals, payouts by month are shown as columns, and the current period as an N of M days passed bar with the preliminary amount.
An account-history candle shows the opening, closing and extreme balance of a day; a day without operations gives a flat candle. The range switches between 30 days, 90 days and all time. This is a balance with deposits and withdrawals, not a return; its growth does not mean profit.
The statement waterfall starts from the opening balance of the period, each movement shifts the balance, and the last bar is the change over the period; the payout forecast is excluded. The statement can be downloaded as PDF or CSV. In Terms & accruals the amount for the current period is preliminary: it is not part of the balance and not available for withdrawal.