US economic calendar: Fed, inflation, jobs, GDP
Platform ·
Fed decisions, inflation, jobs and GDP in one calendar — with the figures and how bitcoin, ether, gold, oil and the S&P 500 reacted to them.
The dashboard now has a US economic calendar. It covers the key American releases: Fed rate decisions, CPI and PPI inflation, jobs and unemployment, consumer spending and PCE, GDP, retail sales, JOLTS job openings and jobless claims. Each release shows its time in New York and UTC, the actual figure and the previous one; the history goes back to April 2025.
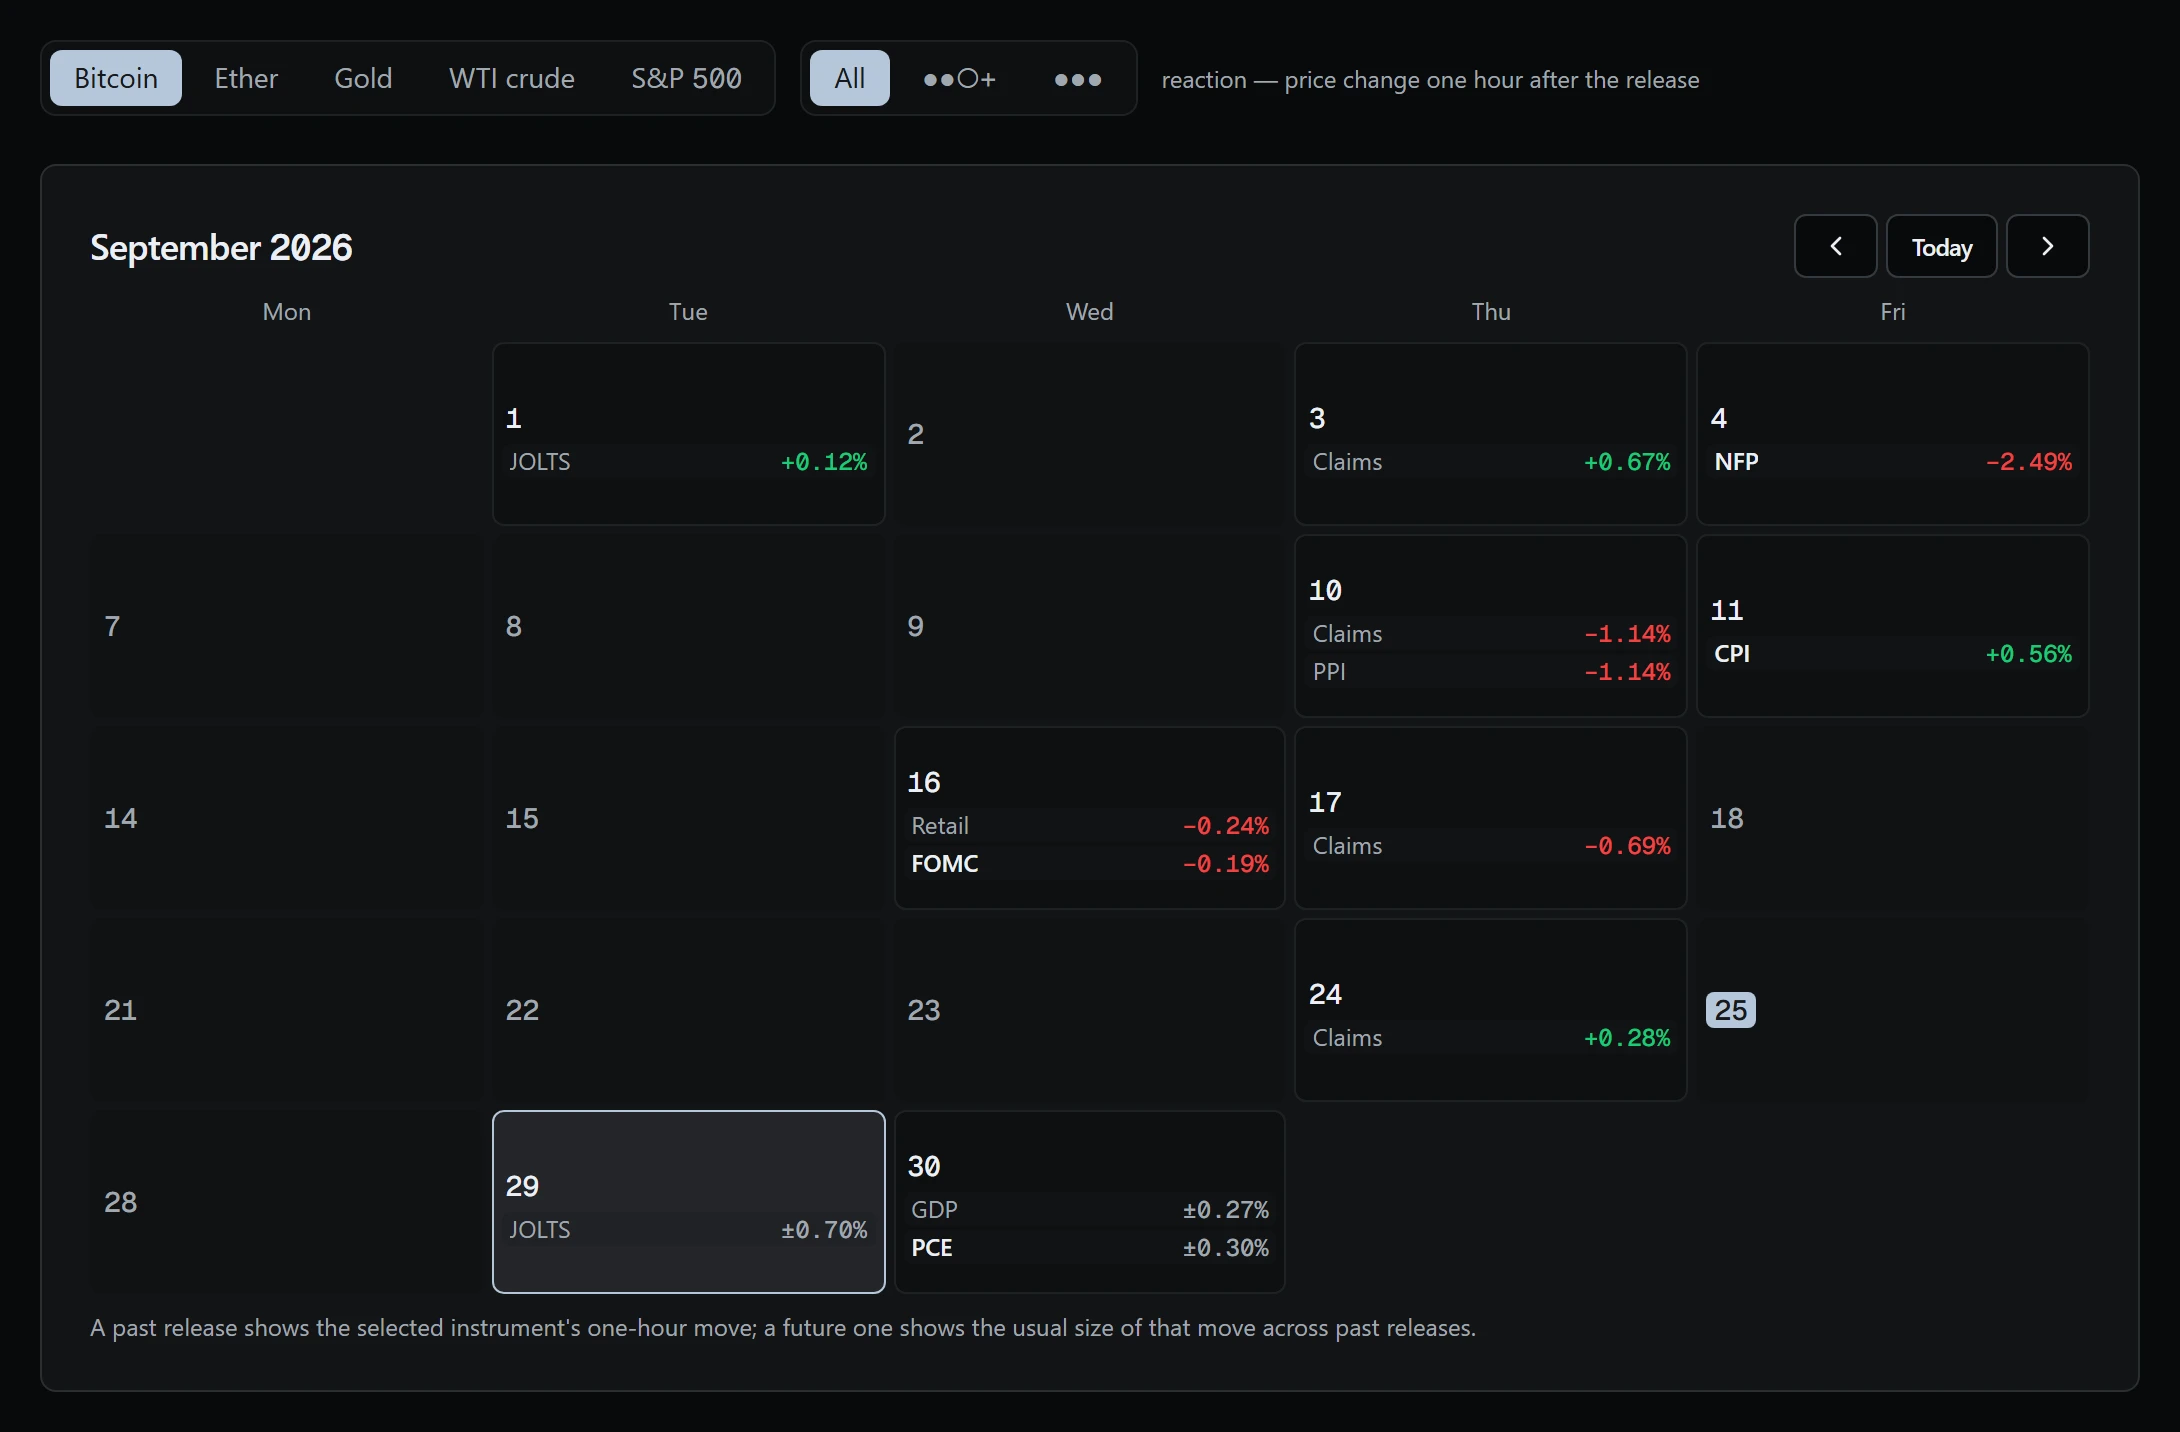
Release dates and figures come from FRED, the database of the Federal Reserve Bank of St. Louis, and the dates of Fed meetings from federalreserve.gov. The update runs hourly: a release whose figures are loaded and all horizons measured is not requested again. The calendar covers 120 days ahead and about a year and a half of history. Each indicator has an importance of one to three dots, and the calendar can be filtered by it.
What matters most is what the market did next. For each release you can see how bitcoin, ether, gold, oil and the S&P 500 moved after 15 minutes, an hour, 4 hours and a day, and the peak of the move within the first 4 hours. Next to it is a control — the same hour a day earlier — to tell a reaction to the figure from the market's usual movement at that time of day.
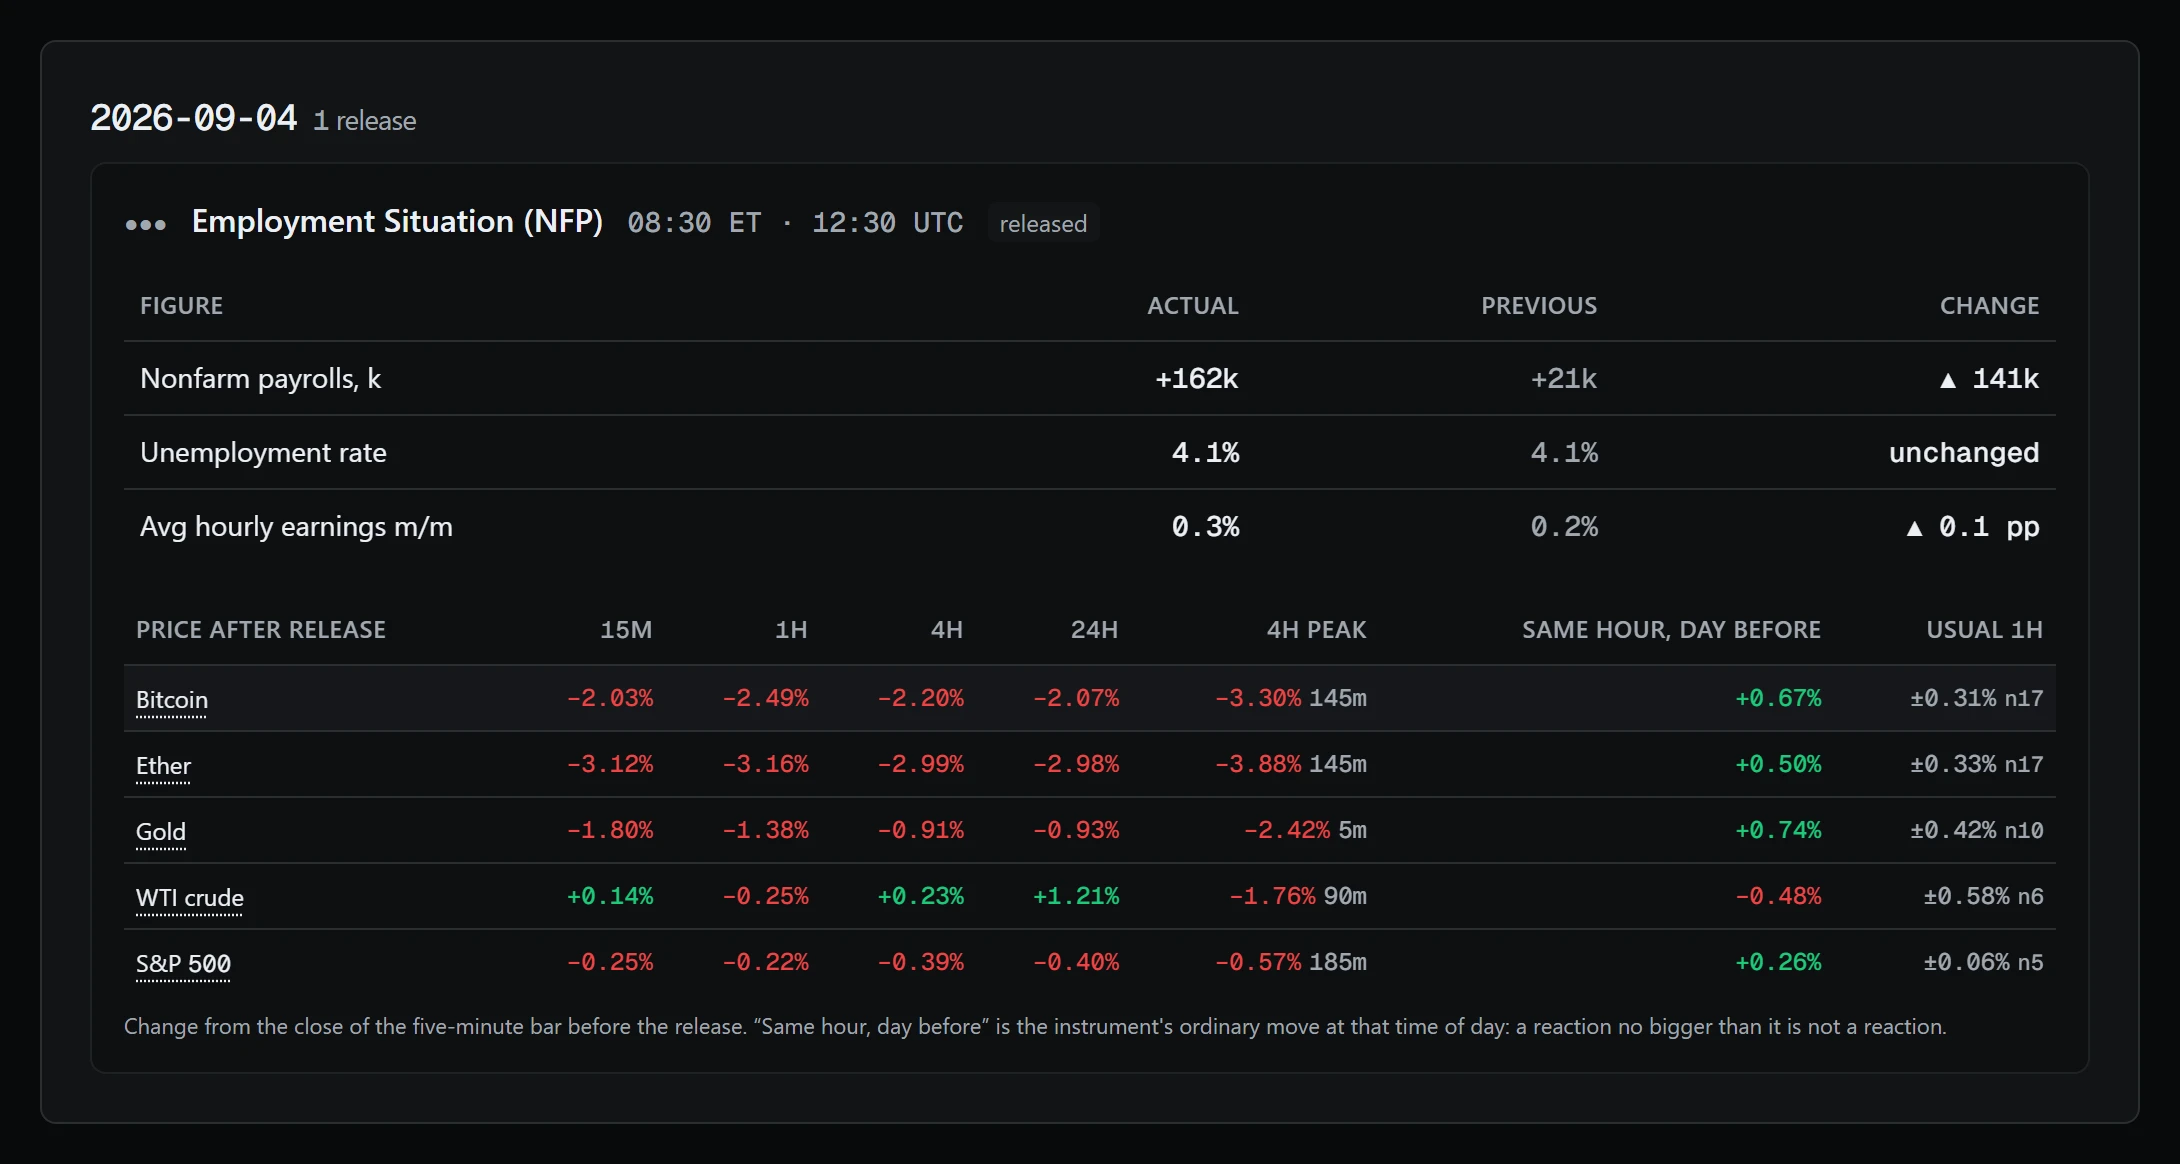
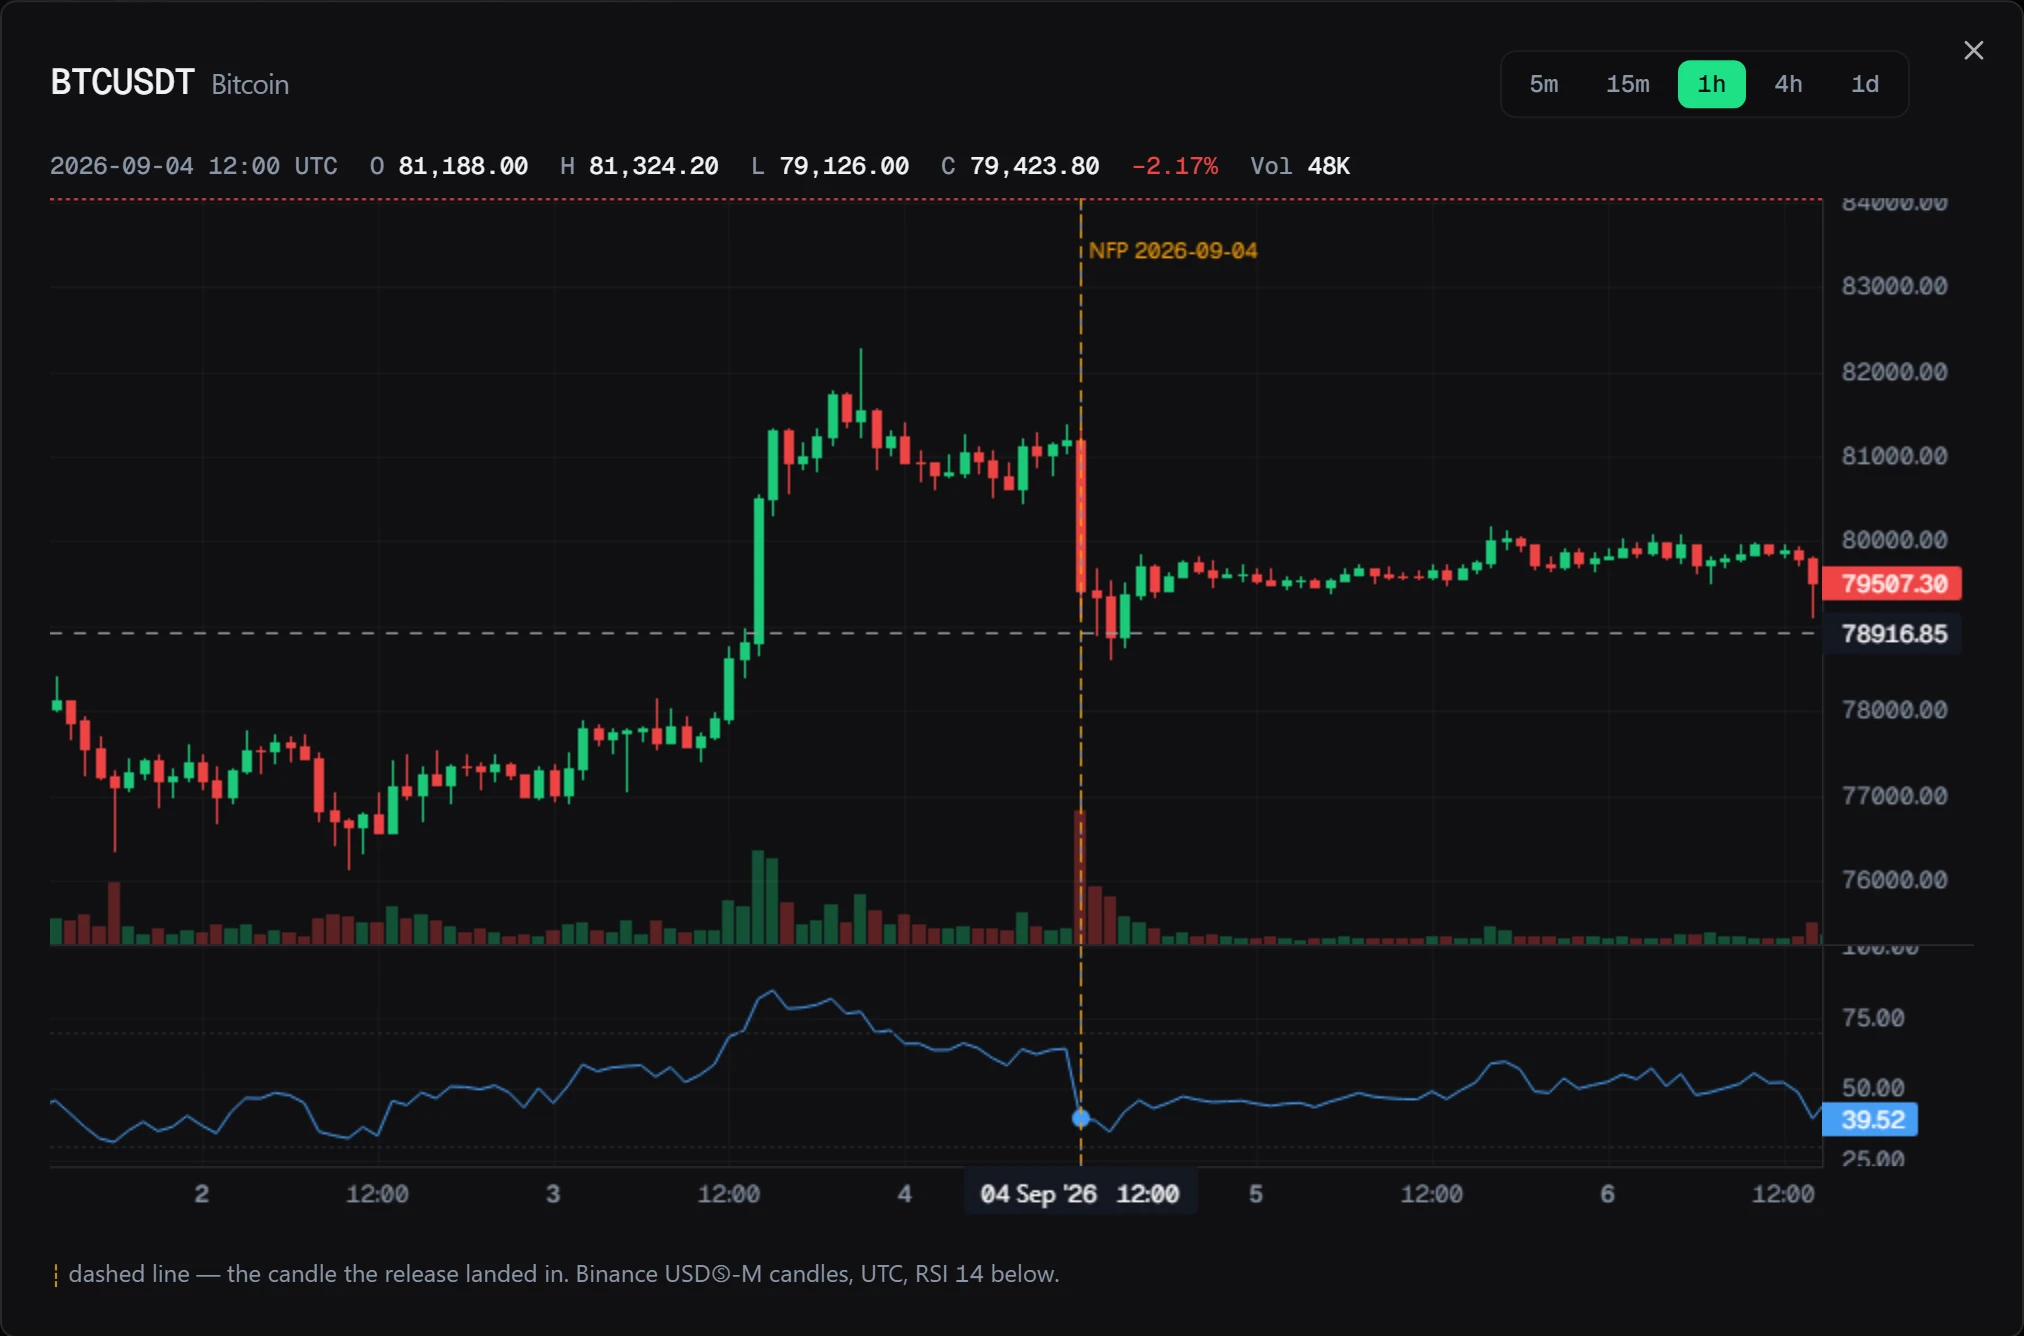
The reaction is measured on five-minute candles of Binance perpetual contracts: BTCUSDT, ETHUSDT, XAUUSDT (gold), CLUSDT (WTI crude) and SPYUSDT (S&P 500). The base is the close of the candle before the release. The main horizon is one hour: the market has had time to digest the figure, while other news has not yet covered it. The peak is searched within four hours, with the minutes until it. A horizon the candles have not reached is shown as not measured, not as zero.
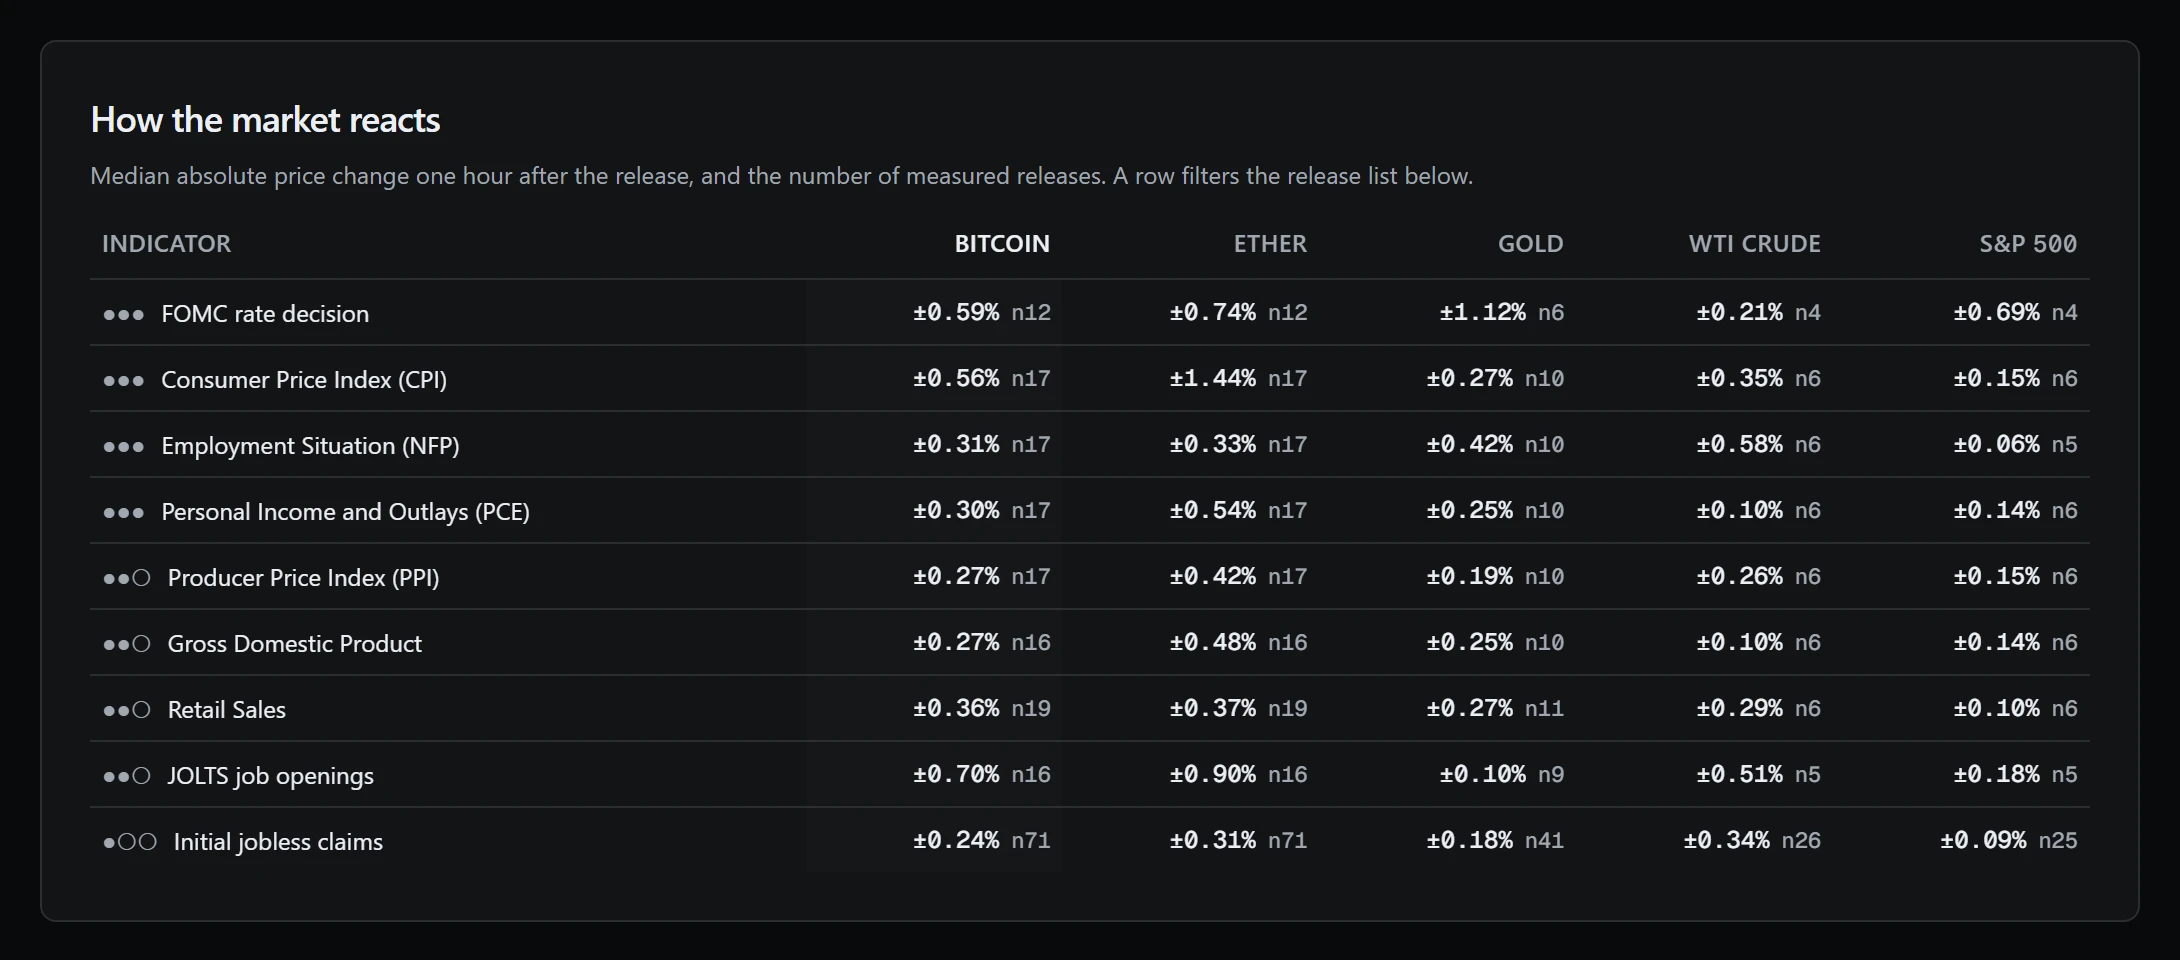
A summary table shows which releases usually move the market the most: the median price change in the hour after the release, per indicator and instrument, with the number of releases measured. For upcoming releases the calendar shows the usual size of that move in advance. Figures come from FRED as they were published on release day — the market reacted to those, not to later revisions.
A cell's colour shows how many times the median one-hour move exceeds the move of the same hour a day earlier; grey means the reaction cannot be told from an ordinary hour. For upcoming releases the row What history suggests gives the usual move, a larger one (80th percentile), the usual time to the peak and how often the price rose or fell after figures above and below the previous value. With no open analyst consensus, above and below mean against the previous value of the headline figure.
The method has limits. Other news can come out in the same hour as a release, so a reaction does not prove a cause. For rare indicators few releases have been measured, and their number sits next to each median. If the hourly export misses runs, a warning about the age of the snapshot appears above the calendar. The section describes how prices behaved in the past, does not forecast them and is not investment advice. Trading with leverage carries a risk of losing money.