Open interest across exchanges: all of a coin's positions on one chart
Platform ·
On the Liquidations page: combined open interest from Binance, Bybit, OKX, Gate and Hyperliquid for 30 coins, with history back to October 2024 and each exchange's share.
The Liquidations page has a new Open interest across venues block. In perpetual contracts longs always equal shorts, so open interest is the size of all open positions on one side. The block adds it up across five exchanges — Binance, Bybit, OKX, Gate and Hyperliquid — and counts it in coins rather than dollars, so a rising price doesn't pass itself off as new positions coming in.
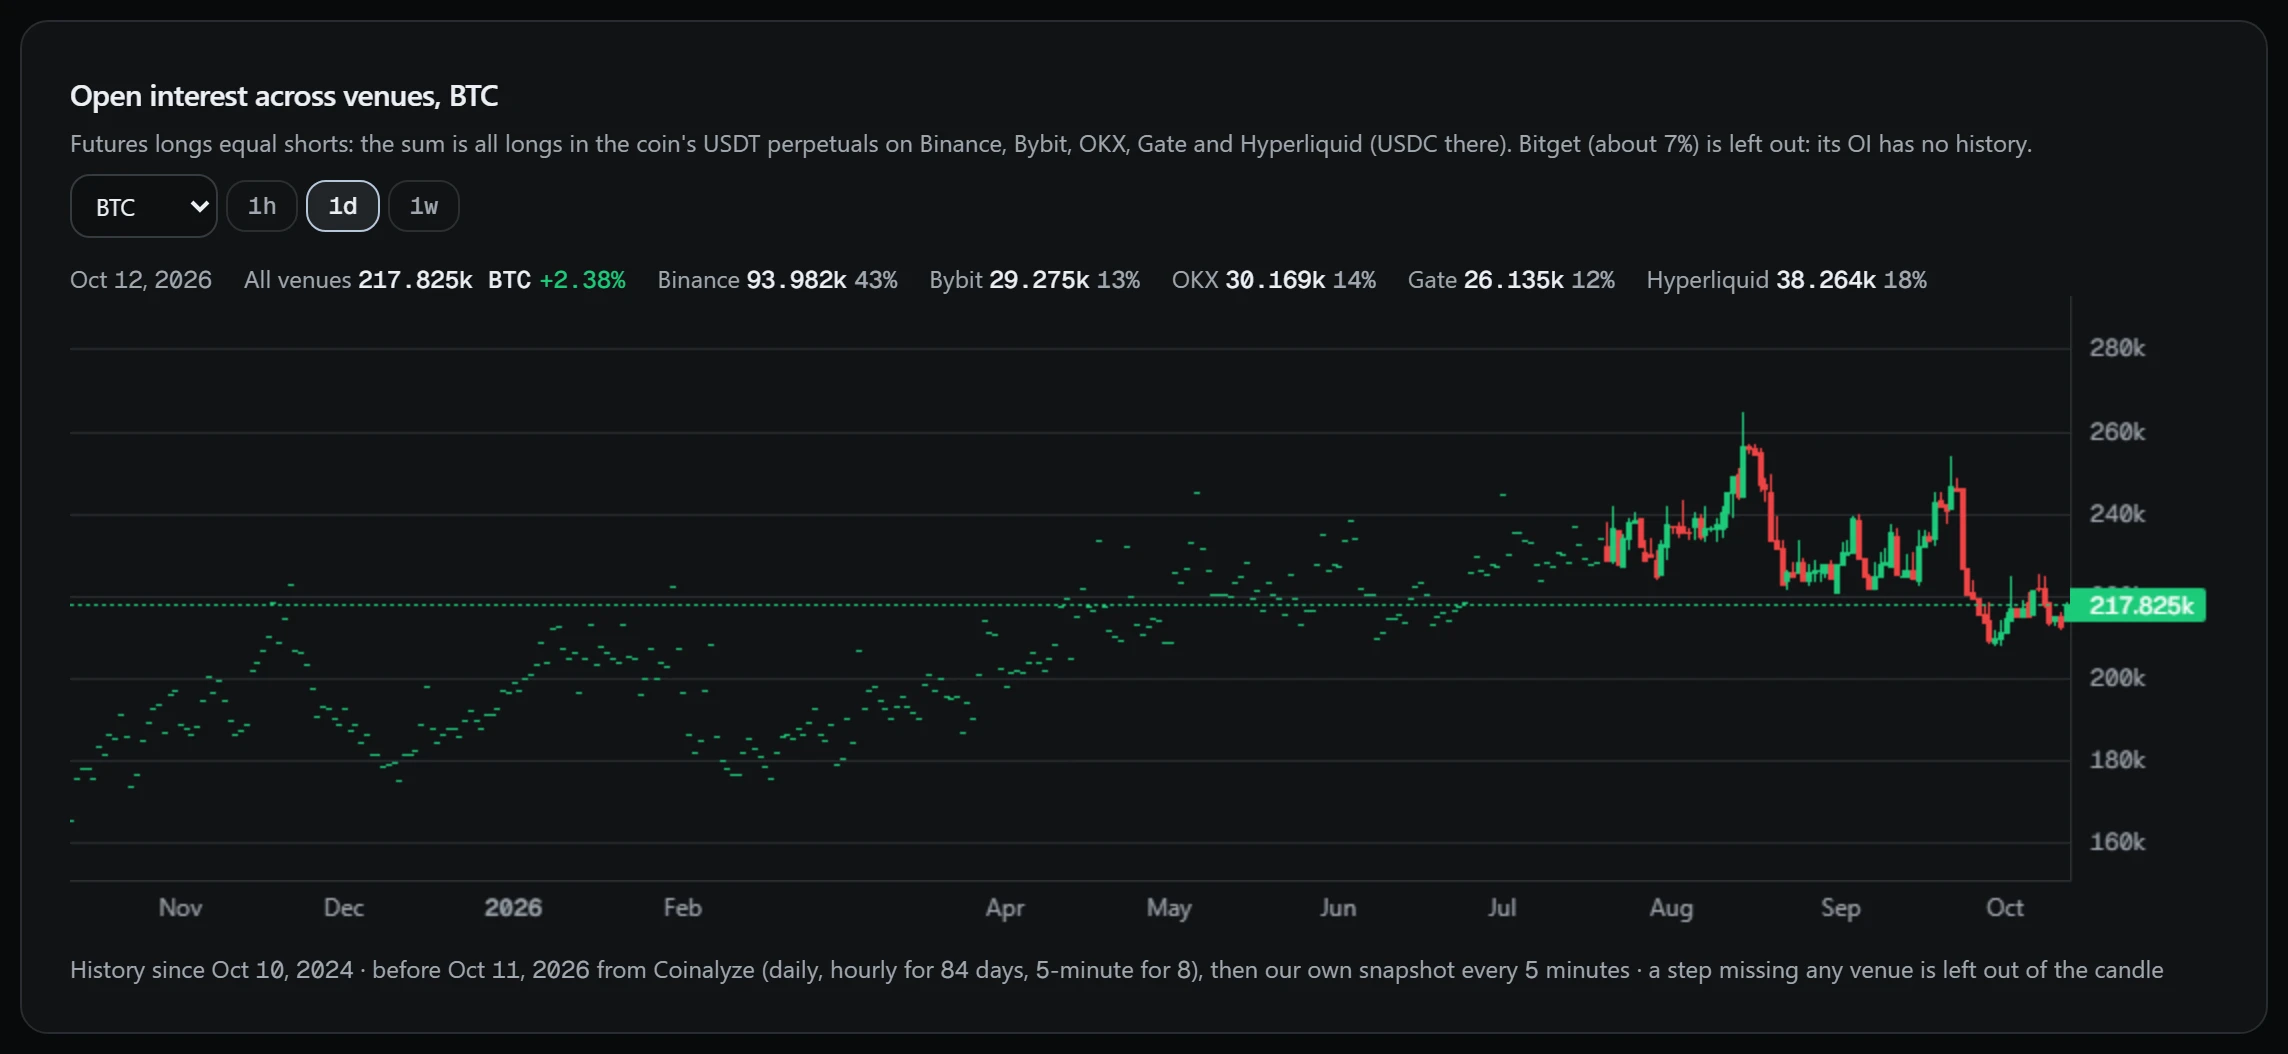
Exchanges count open interest differently: Bybit and Bitget report both sides, while Binance, OKX, Gate and Hyperliquid report one. The block converts everything to one side, takes each exchange's USDT perpetuals (USDC on Hyperliquid) and strips the multiplier from the ticker: 1000PEPE and kPEPE count as thousands of PEPE. So the chart shows the sum of one side in coins, not in dollars and not both sides at once.
It covers the 30 most liquid coins, from BTC and ETH to HYPE, SUI and TAO, on three intervals: hourly candles over two weeks, daily over a year and weekly over 800 days. Above the chart are the total, its change, and each exchange's value and share on the selected candle. History from before our own collection began was loaded from Coinalyze and checked against it; from then on the data is captured every 5 minutes. Bitget is left out of the total: its open interest history isn't available anywhere, and it would put a step into the chart.
History before our own collection was loaded once from Coinalyze: daily for the whole depth of the window, hourly for 84 days and 5-minute for 8 days. After that our own snapshot is taken every 5 minutes with one request per exchange for all contracts. Each series is checked against our own collection over their common stretch before writing, and one deviating by more than 3% is not written. For Binance, where we have our own archive, the summary takes the archive, and the loaded series covers earlier dates.
A candle is drawn only where every exchange that had begun collecting the coin has data: a step missing one of them is left out of the candle, otherwise the missing exchange would draw a false wick downward. An exchange that lists the coin later makes a genuine step up. Bitget is captured but left out of the total for now: its snapshots accumulate, and it joins once it has enough history. Days and weeks are cut by UTC, weeks start on Monday, so labels carry UTC dates.
Open interest rising with the price points to new positions, falling to closures, and next to the liquidations you can see when the market is being unwound by force. The page's colours have also changed: long liquidations are now red and short liquidations green, as on the account overview. The colour shows the pressure on price: a liquidated long is a forced sale, a liquidated short a forced buy.
In the dashboard the block appears on the Liquidations page, which collects forced closures on Binance, Bybit, OKX and Gate, and on the instrument card for Binance perpetual contracts from this coin list. It needs full access, and the block is a separate module that can be switched off. An exchange without the right to display its data is left out of the total. The data is market reference: trading perpetual contracts carries a risk of losing money, and this is not investment advice.