How to test a trading strategy before risking real money: backtest, forward test and sample size
Learning to trade · · 8 min
To test a trading strategy before risking real money, run it in two stages: first a backtest on historical data with fees and slippage, then a forward test on data the strategy has never seen. Judge it on hundreds of trades across different market states. Even a tested strategy does not guarantee a result: trading carries the risk of losing money.
By Viktor Skrin
Why does a trading strategy look better on history than in live trading?
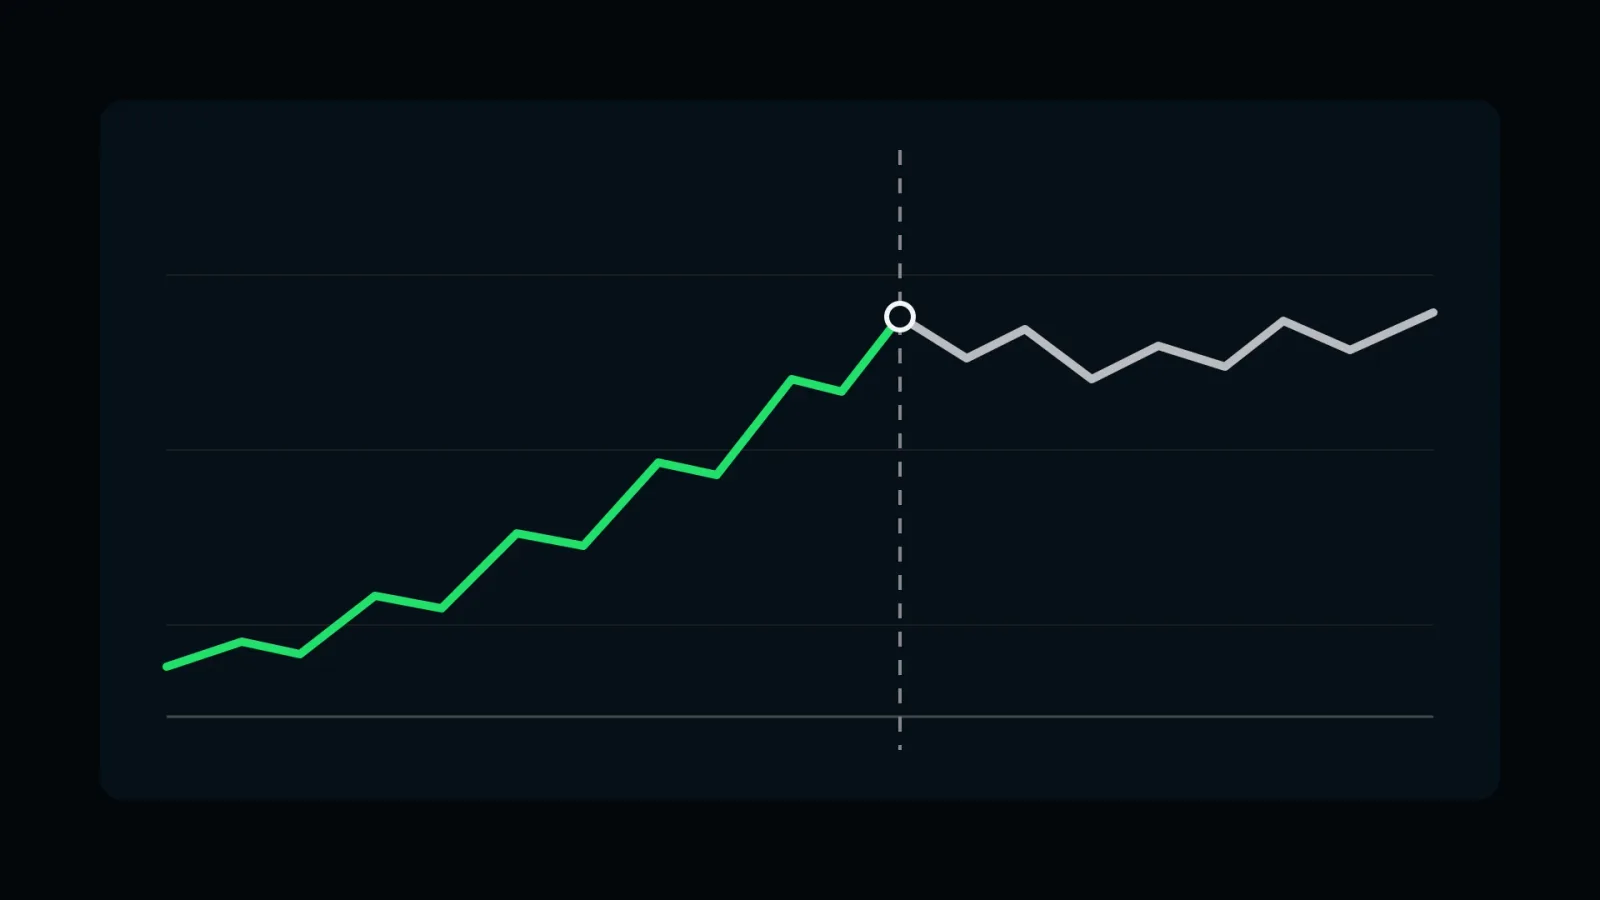
Because its rules were tuned on the same data that was later used to measure the result. The author takes past prices and changes levels, indicator periods and filters until the equity curve looks smooth. That curve shows how well the rules fit the past. It does not show whether the strategy will work on new data.
Testing answers a different question: does the result survive once costs are subtracted and the data is something the strategy has never seen? That takes two stages, a backtest and a forward test, plus a trade sample large enough to tell luck from a pattern.
What is a backtest and where does it mislead?
A backtest applies the strategy's rules to historical data and records every trade. It works as a first filter: if the rules produce nothing even on history, there is no reason to risk money on them. A positive backtest proves nothing yet, because it has typical errors.
| Error | What happens | What to do about it |
|---|---|---|
| Overfitting | Parameters are fitted to one stretch of history and describe noise | Test on data that took no part in tuning |
| Look-ahead bias | A signal uses data that did not exist at that moment | Check the timestamp of every value, enter no earlier than the bar close |
| No costs | The result is overstated by fees, slippage and funding | Subtract costs from every trade |
| Survivorship bias | The test covers only assets that trade today; delisted ones dropped out | Use the market's composition as of each date in the period |
| Small sample | A few lucky trades look like a system | Count the trades and the margin of error (table below) |
A backtest can also be done by hand: open a historical chart, cover the right side and move bar by bar, logging trades by the rules in a spreadsheet. It is slow, but it shows at once whether the rules can be followed without a hint from the future.
How do you account for fees, slippage and funding?
Costs are subtracted from every trade in the backtest, otherwise the result is overstated. There are three:
- Exchange fee. Charged when the position is opened and again when it is closed; rates differ for limit orders (maker) and market orders (taker). Check the current schedule on the fee page of the exchange you trade on.
- Slippage. The gap between the signal price and the fill price. It grows with order size and during sharp moves.
- Funding. In perpetual contracts this is a periodic payment between holders of longs and shorts. If a position is held past one settlement period, it becomes part of the result. How it works is covered in the article on the funding rate.
Hypothetical example, not the result of a real account. A strategy makes 20 trades a day, each with a notional of 5,000 USDT. Opening and closing give 10,000 USDT of turnover per trade and 200,000 USDT a day. At an assumed rate of 0.05% of turnover that is 100 USDT in fees a day and 3,000 USDT over 30 days. The strategy has to earn that much just to break even, and slippage is not yet included.
What is overfitting and how do you spot it?
Overfitting (curve fitting) is when the rules describe the random features of one stretch of history instead of a repeating pattern. On its own sample such a strategy looks excellent; on new data the result disappears.
Signs of overfitting:
- Many tunable parameters and few trades. The more parameters, the easier it is to fit them to noise and the more data you need to test them.
- The result breaks when a parameter shifts slightly. If an indicator period of 20 makes a profit while 19 and 21 make a loss, you have found a coincidence.
- The forward test is far worse than the backtest. Some deterioration is usual; a result that changes sign points to fitting.
- The result rests on a handful of trades. Remove the five best trades and look at what is left.
There is one defence: before you start, split the data into a development part and a test part, and do not look at the second.
How do you run a forward test?
A forward test (out-of-sample test) checks the strategy on data that took no part in development. There are two options: a held-back stretch of history, or real-time trading on a demo account or with minimal size.
- Split the history into two parts, for example 70% for development and 30% for testing.
- Build and tune the strategy on the first part only.
- Write the rules down: entry, exit, position size, costs.
- Apply them to the second part once, with no edits.
- Compare with the backtest: number of trades, share of winners, average trade and deepest drawdown.
If you change the rules after step four and run the test again, the held-back stretch is no longer independent: it has become one more sample to fit. You then need a new stretch or real-time trading.
A demo account has its own limit. Its orders do not move the price or wait in the order book queue, so slippage is understated. Trading with minimal size shows execution more honestly, but it already carries the risk of losing money.
How many trades do you need for a conclusion?
Enough for the margin of error to be smaller than the edge you want to measure. For the share of winning trades the error comes from the standard error of a proportion: √(p·(1−p)/n), where p is the share of winners and n is the number of trades. The calculation for p = 50% and a 95% interval (±1.96 standard errors):
| Trades in the sample | Margin of error for the win rate | What it means |
|---|---|---|
| 30 | about ±18 pp | An observed 60% may really be 42% or 78% |
| 100 | about ±10 pp | Only large differences from a random result can be seen |
| 300 | about ±6 pp | Enough for a preliminary conclusion |
| 1,000 | about ±3 pp | Rare events can be assessed too: losing streaks, drawdown depth |
The formula assumes independent trades. In trading they are often linked: one market move produces several similar entries, so the true error is larger than the calculated one. Besides the count, the make-up of the sample matters: rising, falling and sideways markets, calm and sharp ones.
How is testing an intraday trading strategy different?
An intraday strategy collects trades quickly but depends more on costs and data quality. The average intraday trade is small, so fees and slippage take a visible part of it, as in the example above. The backtest needs minute or tick data: daily candles do not show which was hit first, the stop or the target. And a hundred trades collected in two weeks describe one market state, so the test period has to be longer than the trade count alone requires.
How does strategy testing relate to risk management and to judging a manager?
The strategy decides when to enter and exit; risk management decides what share of the account to risk per trade. They are tested separately: a strategy with a positive sample can wipe out an account in a losing streak if the position is too large. Position sizing is covered in the article on the 1 percent rule.
The same approach works when you assess someone else's trading. A history of real trades is a forward test; a backtest curve is not. What to look at is described in the article on how to check a fund manager. The Sufics home page has a trade feed. The result of a trade there is shown as a percentage of the margin of a leveraged position, not of the account, so the units have to be aligned before comparing with a backtest.
When can a trading strategy be called tested?
When every item holds:
- the rules are written so that another person would get the same trades from them;
- the backtest includes fees, slippage and funding;
- the forward test was run once on data that took no part in development;
- the sample holds hundreds of trades from different market states;
- the result holds when parameters change slightly;
- position size and the loss limit are set separately from the signals.
Testing lowers the risk of error but does not remove it: the market changes and a pattern can vanish. That is why live results are compared with the test all the time, and when they diverge the size is cut or the strategy is stopped.
Trading carries the risk of losing money. This article is educational and is not investment advice.
Key takeaways
- A backtest filters out rules that do not work, but it does not prove a strategy works: a forward test on unseen data does that.
- Fees, slippage and funding are subtracted from every trade in the test.
- Signs of overfitting: many parameters, a result that breaks when a parameter shifts, a forward test far worse than the backtest.
- With 30 trades the margin of error for the win rate is about ±18 pp; with 1,000 trades it is about ±3 pp.
- Position size is tested separately from the signals; a tested strategy does not guarantee a result.
Frequently asked questions
What is a backtest in simple terms?
A backtest calculates which trades a strategy would have made on past prices if its rules had been followed without exception. It shows how the rules behaved on history. It does not guarantee a future result, and fitting the rules to one stretch of history makes it useless.
How does a forward test differ from a backtest?
A backtest is run on the same data the strategy was tuned on. A forward test is run on data that took no part in tuning: a held-back stretch of history or real time. If the result disappears on new data, the rules were fitted to the past.
Can you test a trading strategy without coding?
Yes. Open a historical chart, cover the right side and move bar by bar, logging every trade by the rules in a spreadsheet: entry, exit, result after fees. It takes longer than an automated test, but it is enough for a first assessment if the rules are written down in advance and do not change along the way.
Is a demo account good enough to test a strategy?
It works as a forward test of the rules, but execution on it is better than in reality: orders do not move the price or wait in a queue, so slippage is understated. After a demo account a strategy is usually tested with minimal size on a real account, and that already carries the risk of losing money.
What is look-ahead bias in a backtest?
It is an error where a rule uses data that did not exist at the moment of the trade. Example: entering at a bar's opening price based on that bar's closing price. Such a test shows a result that cannot be obtained in real trading.
Can a tested strategy stop working?
Yes. Testing shows that a pattern existed on history and on held-back data, but the market changes and the pattern can vanish. That is why live results are compared with the test, and when they diverge the size is cut or the strategy is stopped. Trading carries the risk of losing money.