Maximum drawdown: what it is, how to calculate it and why it is hard to recover
Learning to trade · · 6 min
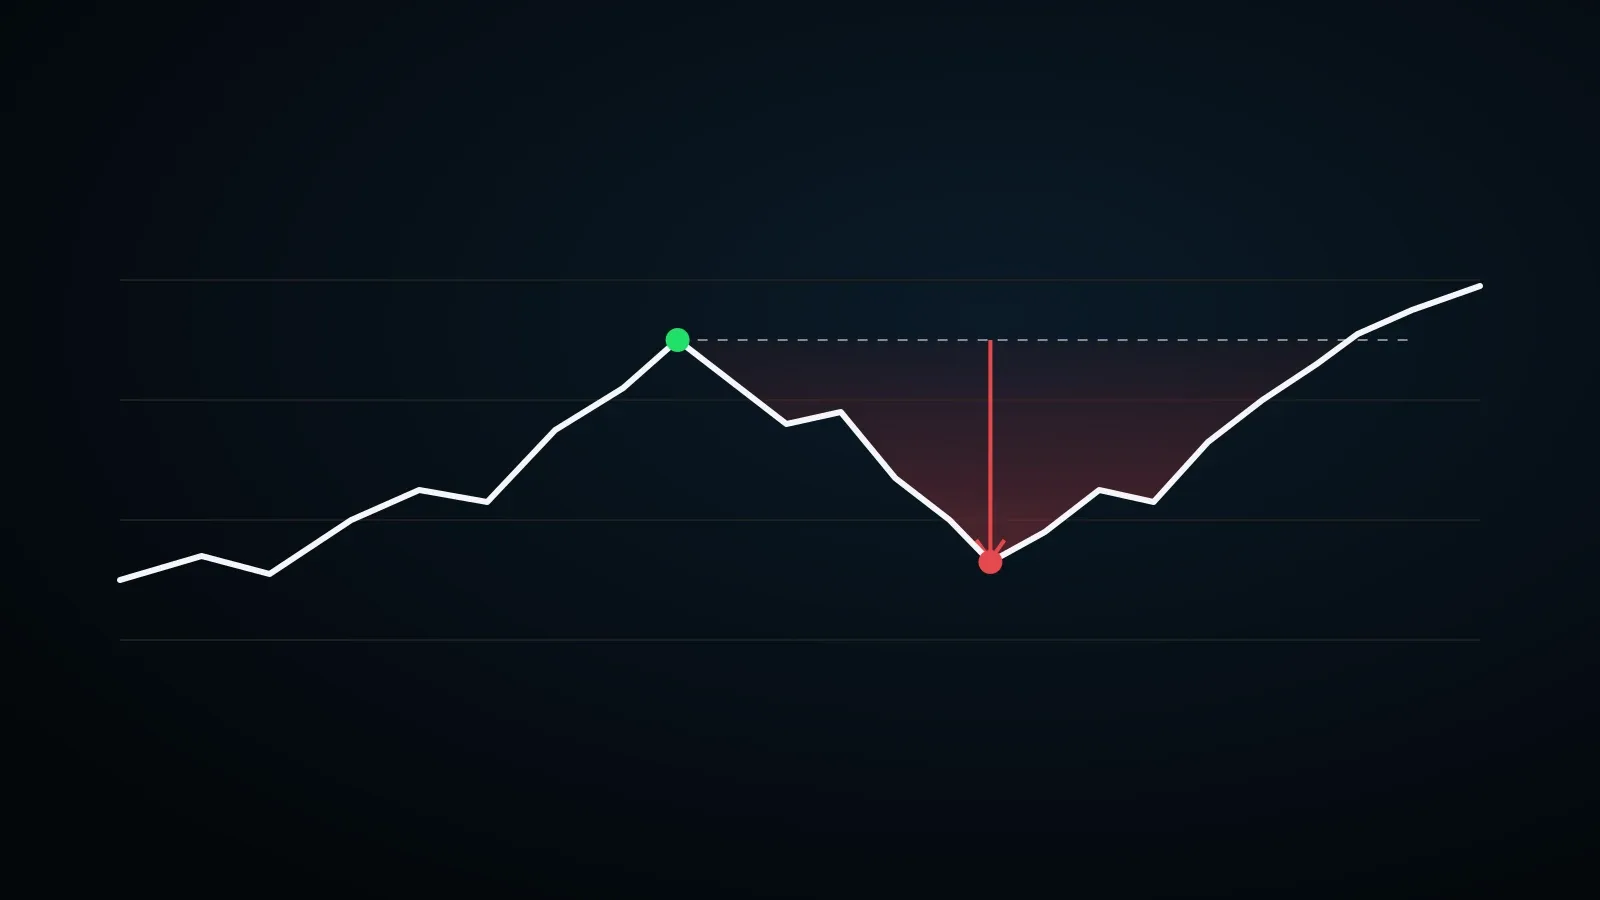
A drawdown is the fall of an account from its latest peak, and maximum drawdown (MDD) is the deepest such fall over a period: (peak − trough after it) / peak. If an account grew to $26,000 and dropped to $20,800, the drawdown is 20%, and getting back to the peak now takes a 25% gain.
By Viktor Skrin
In short: what a drawdown is
| Term | What it means | How to calculate |
|---|---|---|
| Drawdown | the fall of an account from its latest peak | (peak − current value) / peak |
| Maximum drawdown (MDD) | the deepest such fall over a period | (peak − lowest value after it) / peak |
| Drawdown duration | how long the account stayed below the previous peak | date back at the peak − date of the peak |
| Gain needed to recover | how much you must earn to get back to the peak | drawdown / (1 − drawdown) |
What is a drawdown in simple terms?
A drawdown is the distance between the best value an account has reached and what happened to it afterwards. While the account keeps rising, there is no drawdown. Once it drops below its last high, a drawdown starts, and it lasts until the account climbs back to that high.
The point is that a drawdown is measured from the peak, not from the initial deposit. An investor who put in $10,000, grew it to $15,000 and then fell to $12,000 is still up on the money invested. From the peak, though, they lost 20%, and that 20% is what they actually lived through.
How do you calculate maximum drawdown?
Maximum drawdown, or MDD, is the deepest fall from a peak to the following trough over the whole period you look at.
MDD = (peak − trough after that peak) / peak × 100%
A hypothetical example, not the result of a real account. Over a year the account went through these points:
| Month | Account value, $ | Peak to date, $ | Drawdown from peak |
|---|---|---|---|
| January | 20,000 | 20,000 | 0% |
| March | 23,500 | 23,500 | 0% |
| May | 26,000 | 26,000 | 0% |
| July | 22,100 | 26,000 | 15% |
| August | 20,800 | 26,000 | 20% |
| October | 24,700 | 26,000 | 5% |
| December | 27,300 | 27,300 | 0% |
The maximum drawdown here is 20%: from the $26,000 peak in May to the $20,800 trough in August. The year ended up 36.5%, yet in August the investor had a fifth less than three months earlier. The drawdown lasted from May to December, about seven months.
Use the most frequent data you have. On monthly points a drawdown looks shallower than on daily ones: a deep low in the middle of a month disappears if you only look at month-end values.
Why is a drawdown harder to recover than to suffer?
The lost percentage is taken from a larger amount and the recovered one from a smaller amount. So getting back to the peak takes a bigger gain than the drawdown itself:
| Drawdown | Gain needed to get back to the peak |
|---|---|
| 10% | 11.1% |
| 20% | 25% |
| 30% | 42.9% |
| 40% | 66.7% |
| 50% | 100% |
| 75% | 300% |
| 90% | 900% |
Up to 20% the difference is small. Past 40–50%, recovery needs a result that would take most strategies years. Hence the core rule of risk management: limiting how deep a drawdown goes is cheaper than winning it back later.
Drawdown by trades, by account and floating: what is the difference?
The same trading can be described by three different drawdowns, and mixing them up is a common mistake when checking a manager.
- By closed trades. Calculated from the results of positions already closed. It misses a loss sitting in an open position: if a manager holds a losing trade and does not close it, that drawdown is not in the report.
- By account (by equity). Includes open positions at the current price. This is the drawdown the owner of the money actually sees, and it is the one to ask about.
- The result of one trade. A losing trade is not yet an account drawdown. If a trade uses part of the account or leverage, its percentage is measured against the position's margin, not the whole account. How leverage changes that percentage is covered in the article on leverage and liquidation.
In the Sufics feed of closed trades, a trade's result is a percentage of the position's margin with leverage, not of a client's account. So a losing trade in the feed cannot be read as an account drawdown of the same size, and the other way round: you cannot work out an account drawdown from the trade feed.
What drawdown is normal?
There is no single "normal" number: it depends on the market, the strategy and the time frame. What you can do is judge drawdown together with return.
- Return to drawdown ratio. Divide the annual result by the maximum drawdown over the same period. The higher it is, the less risk per percent of return. Only compare strategies over the same period this way.
- Duration. A deep but short drawdown and a shallow one that lasts a year are different stories for an investor who may need the money.
- Cause. A drawdown during a market-wide crash can be explained; the same drawdown in a calm month points to the manager's own decisions.
The reverse also holds: a track record with no drawdowns is not a sign of skill. Real results are uneven. No losing months more often means losses are not shown or are sitting in open positions.
Where do you see a manager's drawdown?
- Ask for the monthly account history with the dates of the peak and the trough of the maximum drawdown.
- Check what it is based on: closed trades or equity with open positions.
- Compare it with the full trade history, losing trades included. Our closed trade feed shows every position.
- Ask whether a third party confirms it: an exchange statement or an independent tracker.
The rest of the checks are in the article how to check a fund manager.
Trading on financial markets carries the risk of losing money, including all of the amount invested. Past returns and drawdowns do not guarantee future ones. This article explains a concept and is not investment advice.
Key takeaways
- A drawdown is measured from the account's peak, not from the amount invested.
- Maximum drawdown = (peak − trough after it) / peak; use the most frequent data you have.
- A drawdown is harder to recover than to suffer: after −50% you need +100%.
- Ask for the drawdown by account equity with open positions, not only by closed trades.
- A loss on one leveraged trade is a percentage of the position's margin, not an account drawdown.
Frequently asked questions
What is a drawdown in simple terms?
It is how far an account has fallen below its latest high. The drawdown lasts until the account gets back to that previous peak.
How do you calculate maximum drawdown?
Find the account's peak and the lowest value after it, then divide the difference by the peak: (peak − trough) / peak × 100%. Of all such falls over a period, the maximum drawdown is the deepest one.
How much do you need to earn to recover a drawdown?
Drawdown / (1 − drawdown). After −20% you need +25%, after −50% you need +100%, after −75% you need +300%.
What is the difference between drawdown by trades and by account?
Drawdown by closed trades misses losses in open positions. Drawdown by account equity includes open positions at the current price, and it is what the owner of the money actually sees.
What drawdown is considered normal?
There is no single number. Judge a drawdown together with the return over the same period, how long it lasted and what caused it: a market-wide crash or the manager's own decisions.
Does a small past drawdown guarantee safety in the future?
No. Trading carries the risk of losing money, and past results, past drawdowns included, do not guarantee future ones.